August 2022, Monthly Binance Smart Chain Analysis – BSC Gas Price Increased by 4.4%
Key data
- The average number of transactions per day in August decreased by 15.2%.
- In August, the average Binance Smart Chain (BSC) gas price increased by 4.4%, compared to July.
- The total number of unique active wallets increased by 19.6%.
BSC transaction statistics
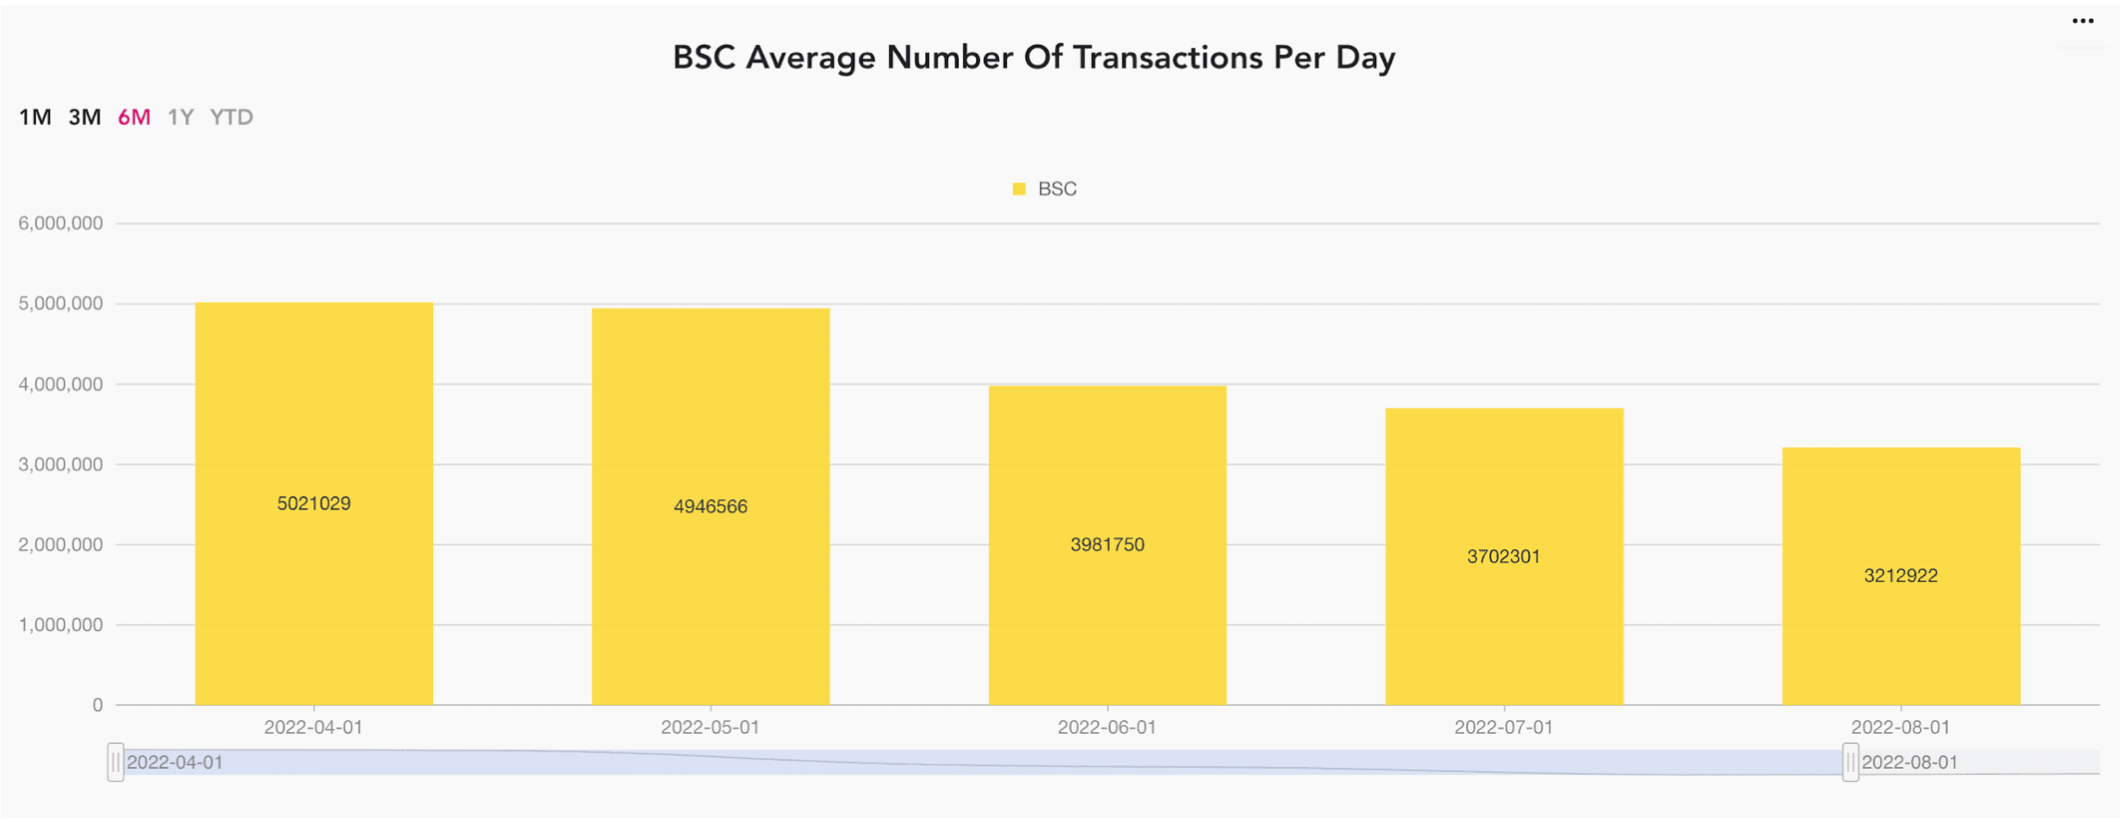
Average number of BSC transactions per day decreased by 15.2%.
The average number of BSC transactions in August was 3,212,922. The average number of BSC transactions in July was 3,702,301. Compared to July, the average number of transactions in August decreased by 15.2%.
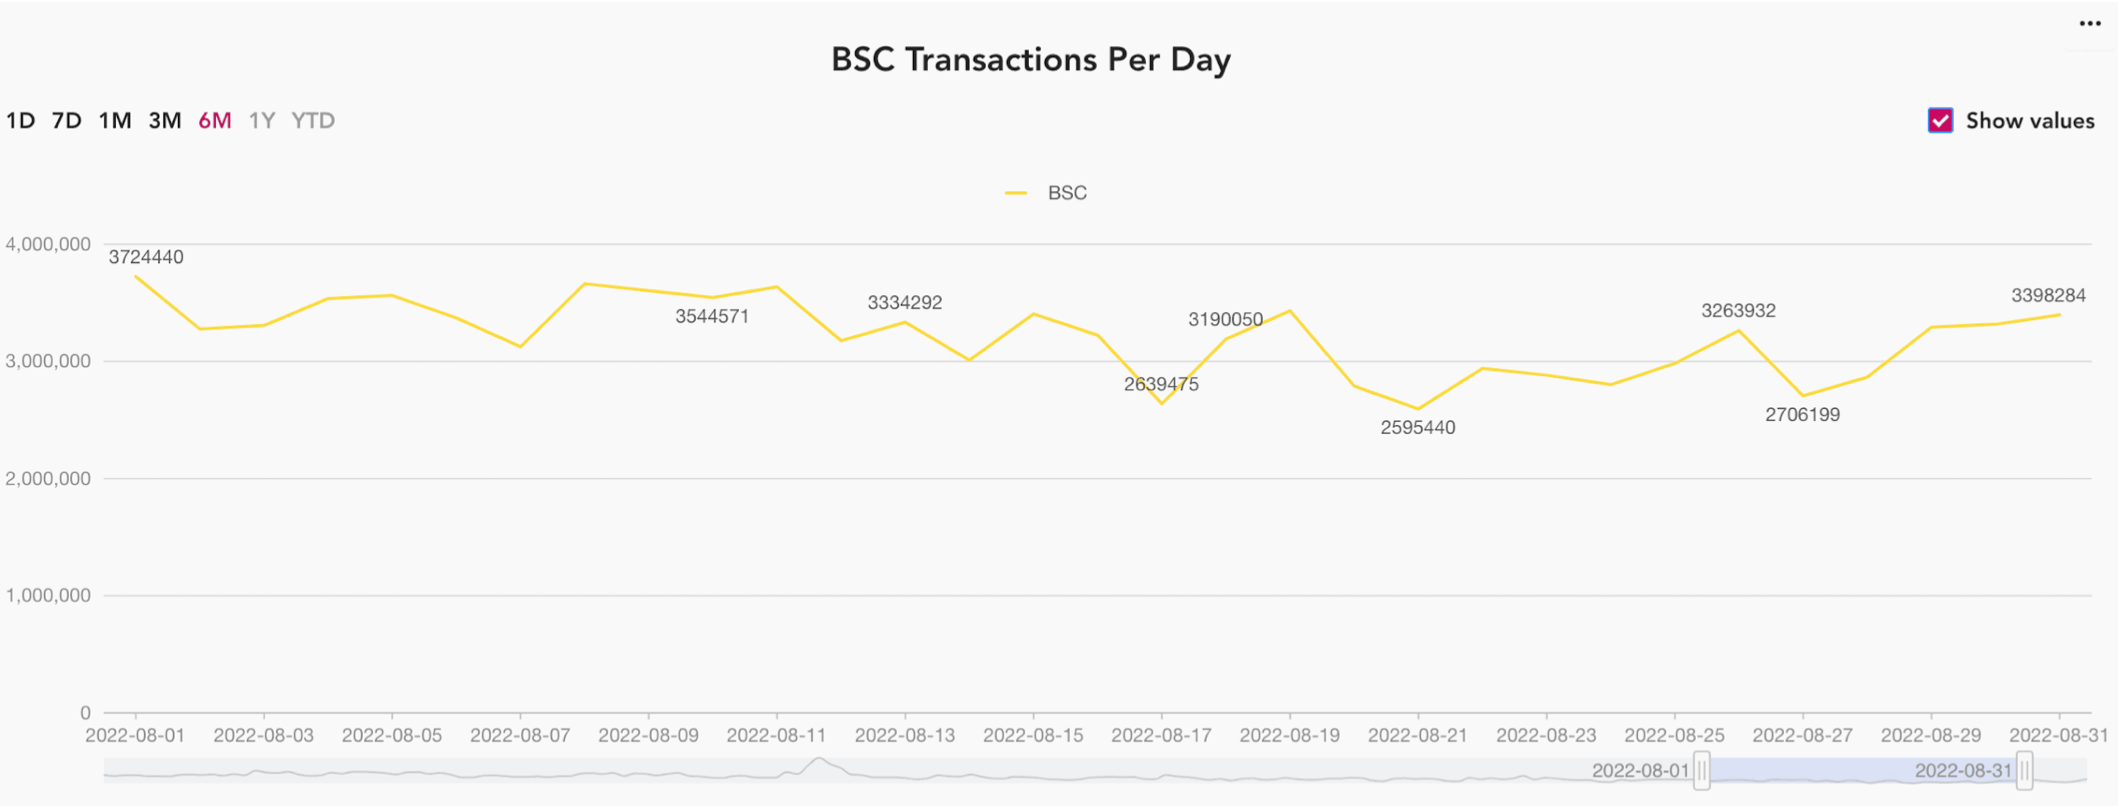
The highest number of transactions per day in August on the Binance Smart Chain were completed on August 1, 2022, with 3,724,440 transactions. The minimum number of 2,595,450 transactions was confirmed on August 21, 2022.
BSC block statistics
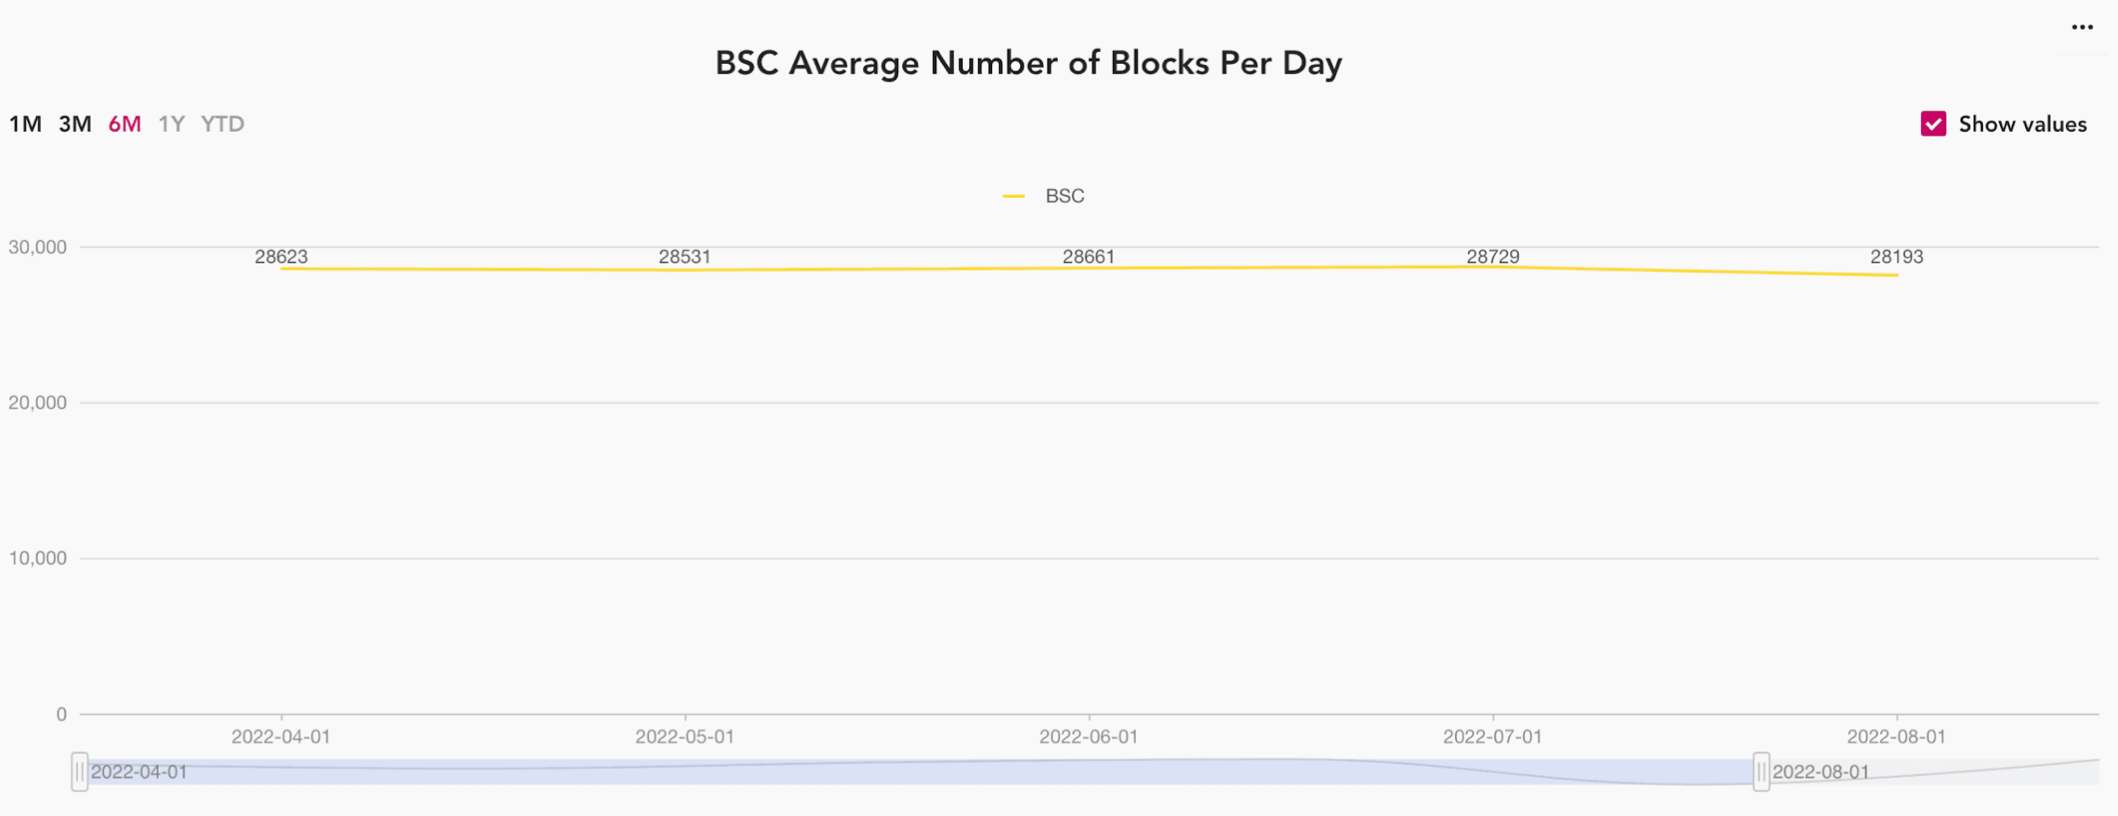
Average number of BSC blocks per day decreased by 1.6%.
The average number of BSC blocks per day in July was 28,729, and the average number of BSC blocks in August was 28,193. The average number of blocks per day on the Binance Smart Chain in August decreased by 1.6%.
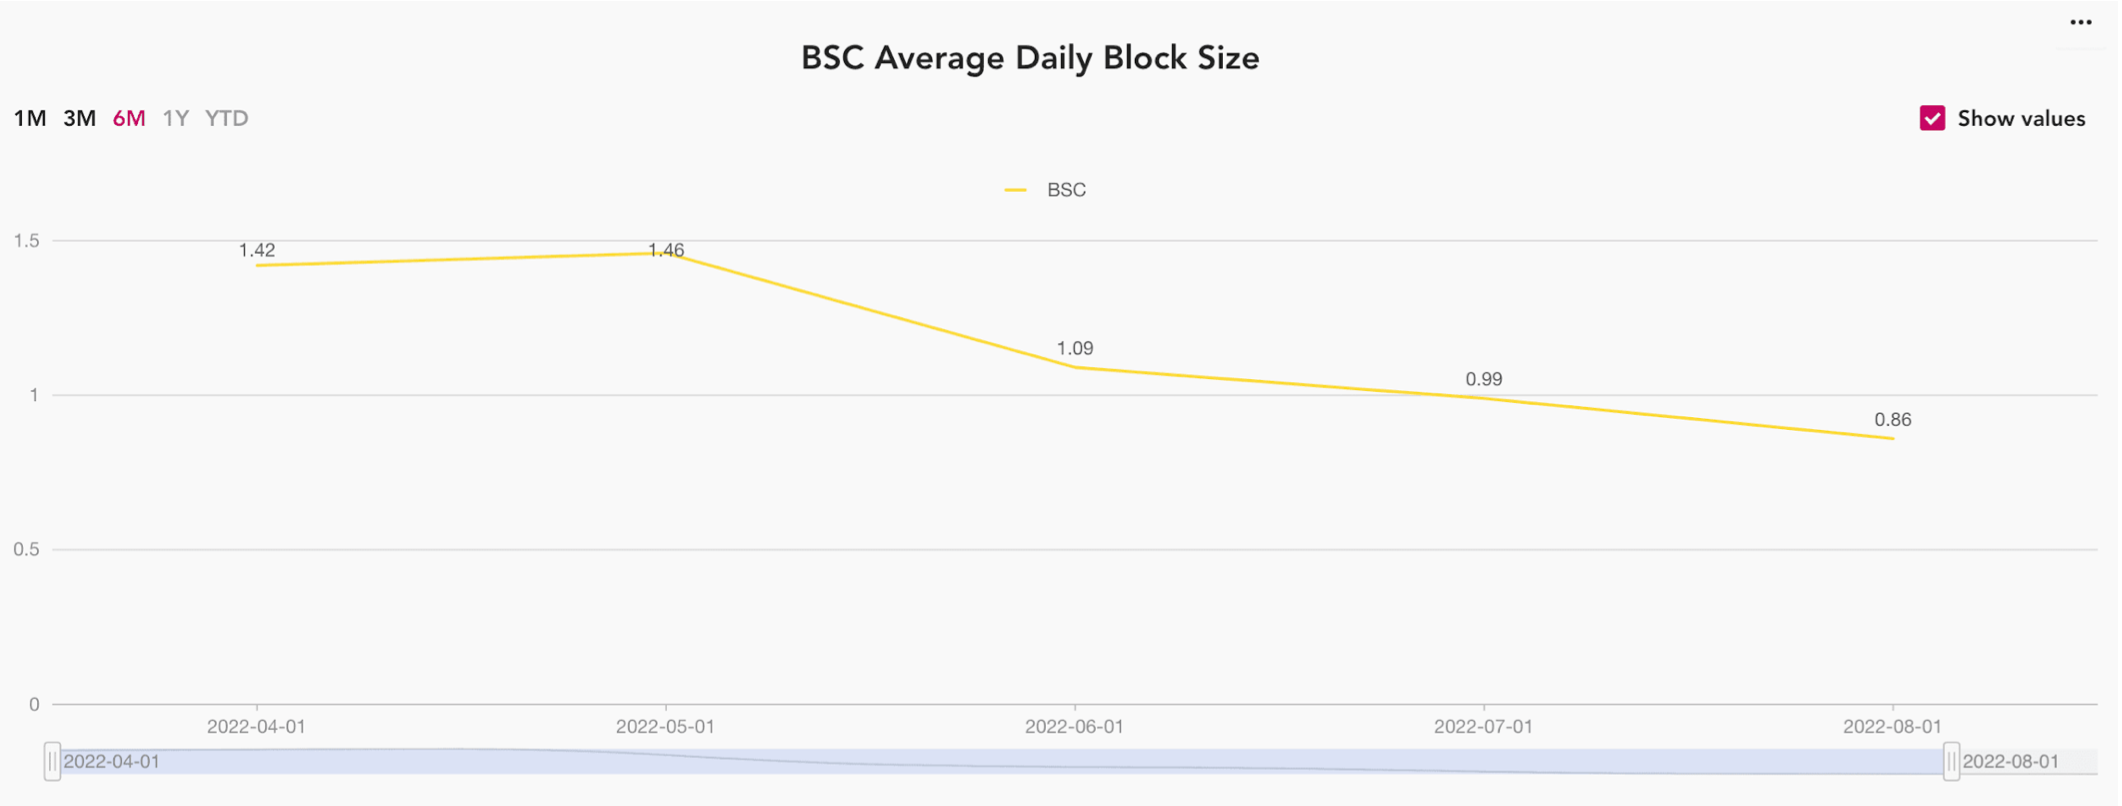
In July, the average size of all blocks validated in one day on the Binance Smart Chain was 0.99 Gb. In August, this value was reduced to 0.86 Gb, which is a decrease of 15.1%.
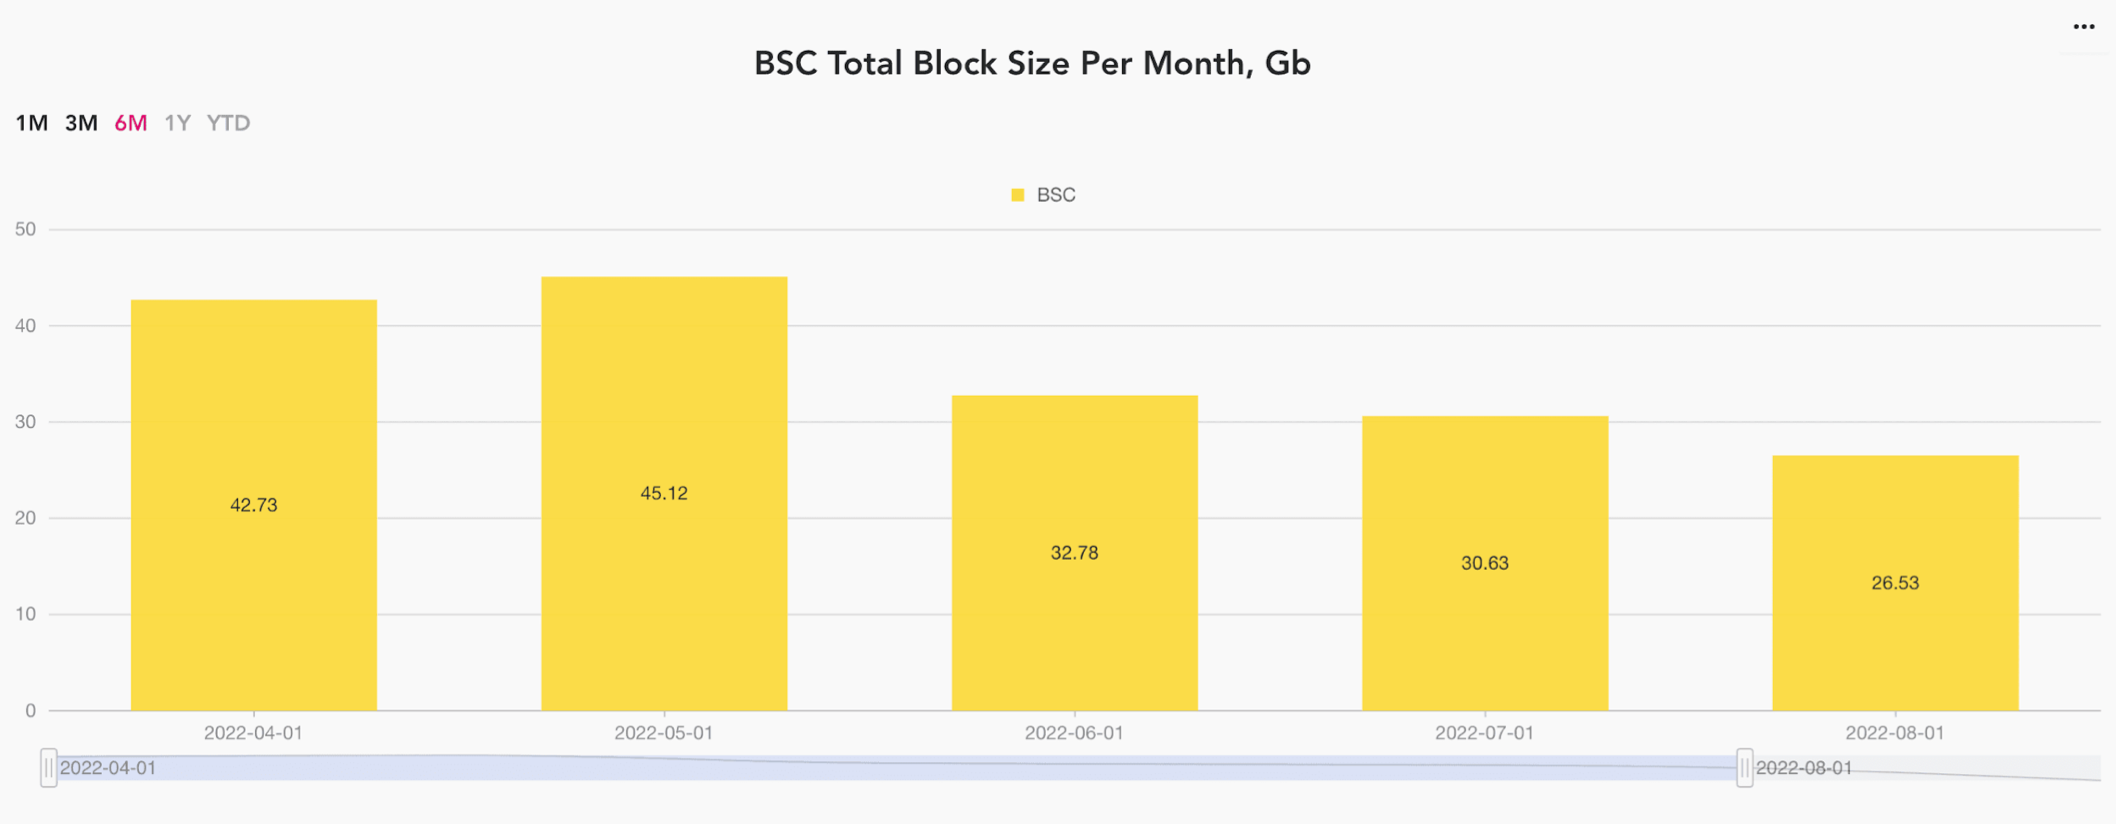
Similar trend is shown on the BSC total block size per month. It can be seen that the total size of blocks mined per month in the Binance Smart Chain in August 2022 was 26.53 Gb. In July 2022, this amount was 30.63 Gb, which is a decrease of 15.5%.
BSC gas prices statistics
Average BSC gas price increased by 4.4%.
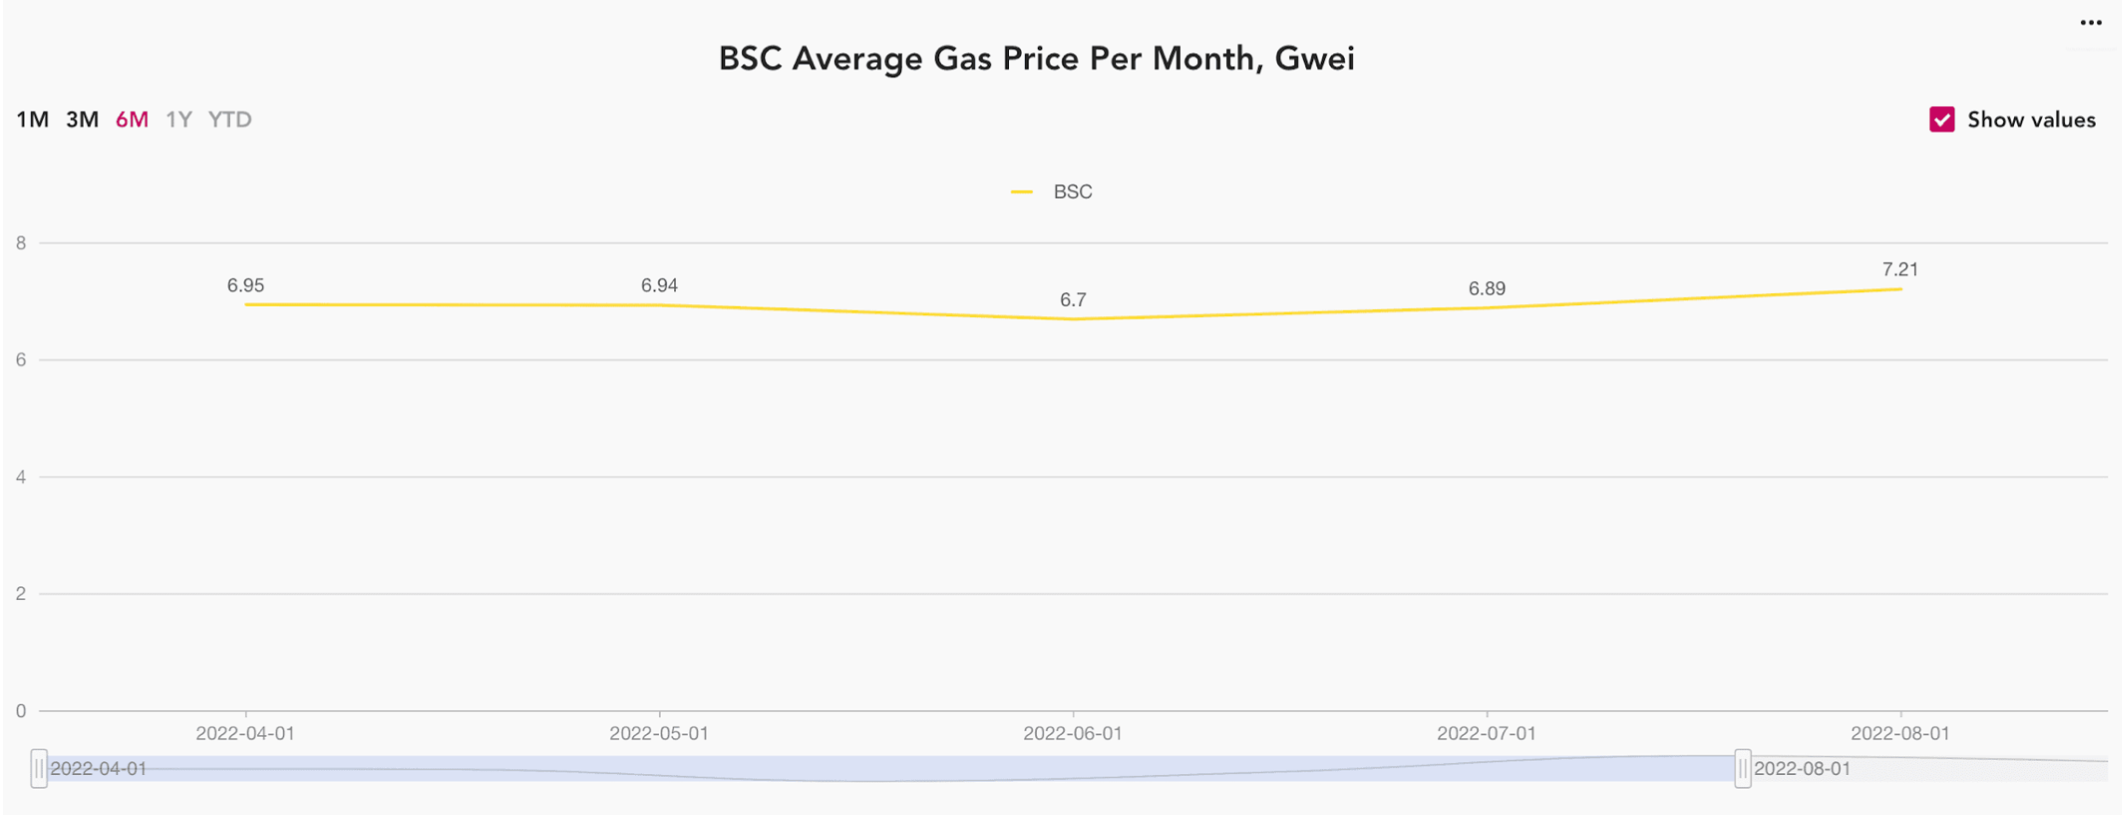
The average gas price on the Binance Smart Chain in July was 6.89 gwei. In August, it increased by 4.4% and was 7.21 gwei.
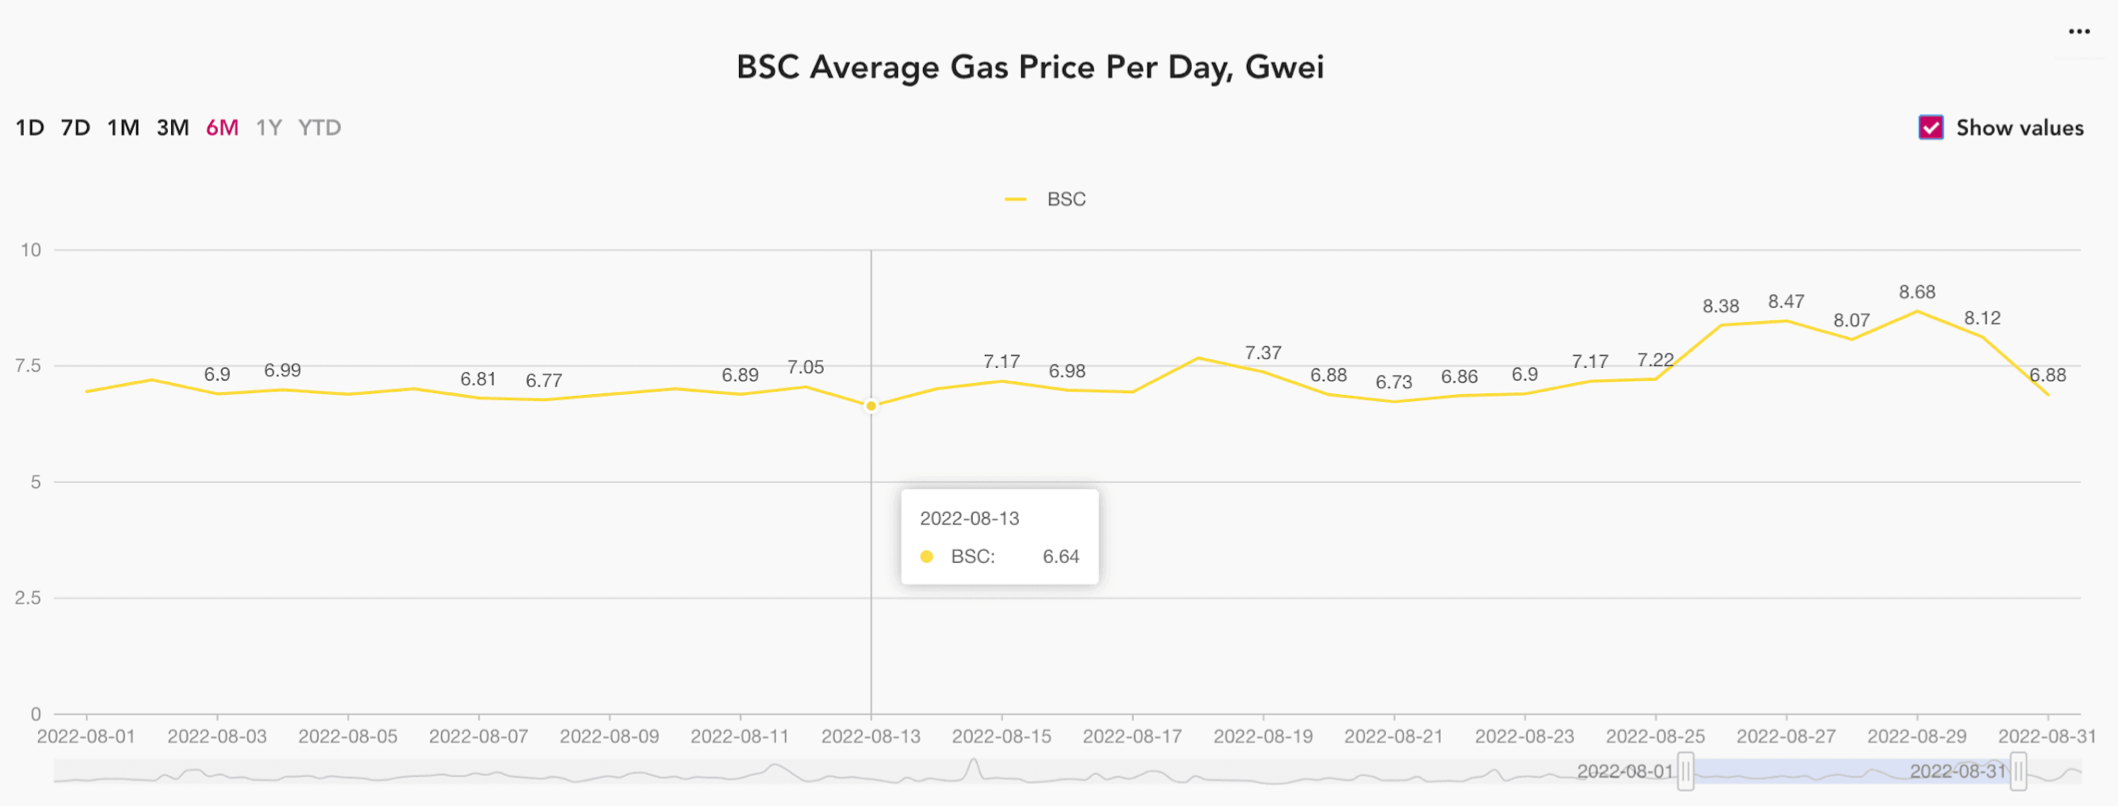
The highest gas price, fixed in August, was on August 29, 2922, when it reached the value of 8.68 gwei. The lowest gas price, fixed in August, was on August 13, 2022, and equaled 6.64 gwei.
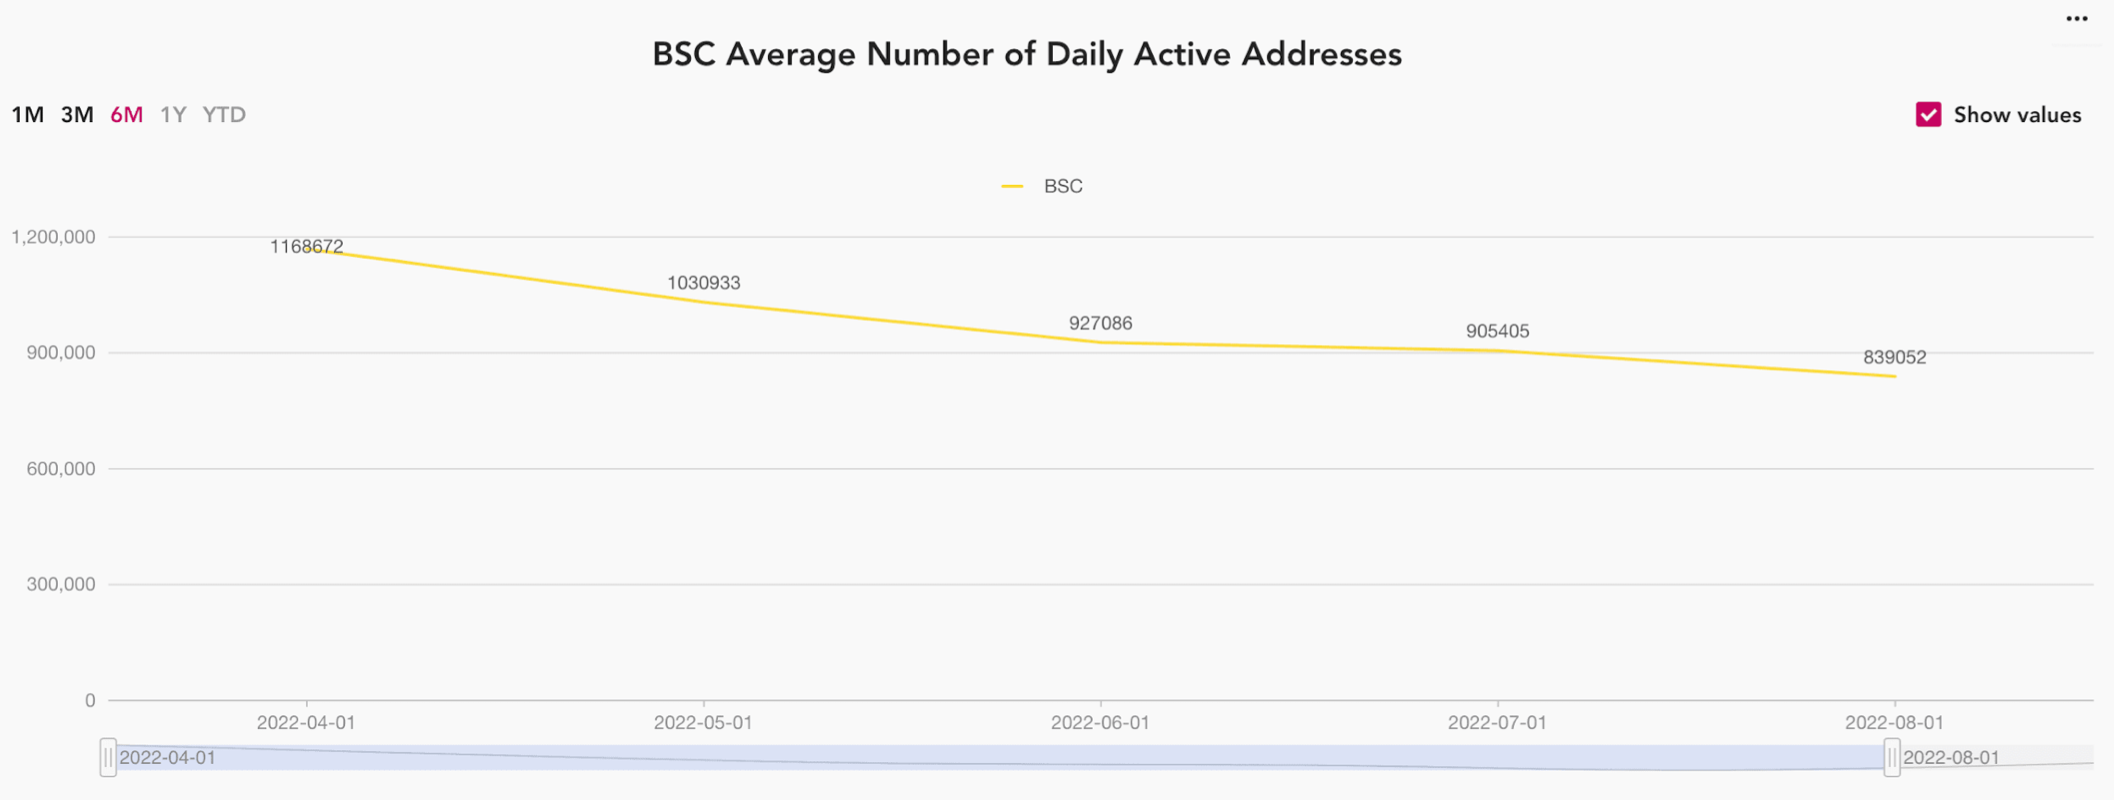
BSC active addresses statistics
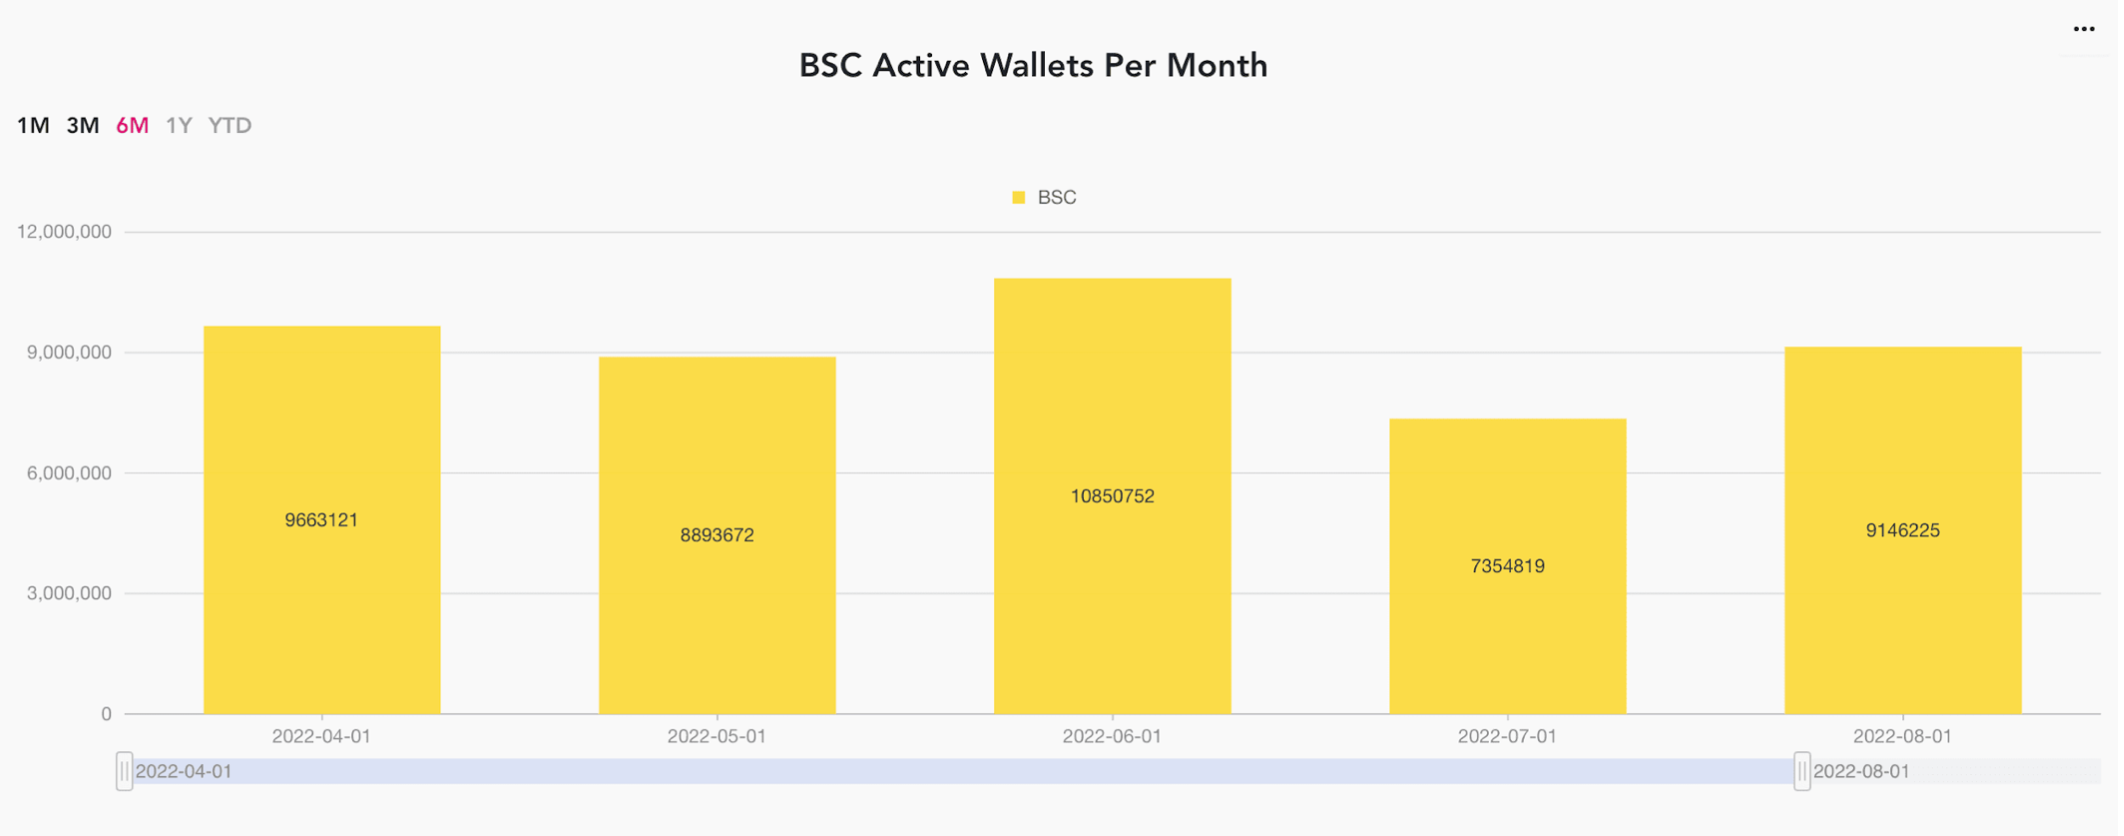
In August, the total number of unique active wallets increased by 19.6%.
In July, the average number of daily active addresses on the Binance Smart Chain was 905,405. In August, this number decreased by 7.9% and was 839,052.
The total number of unique active crypto wallets in July was 7,354,819. In August, this value increased by 19.6% and was 9,146,225. The average number of unique active crypto wallets per day was 871,973 in July.
In August, this value decreased by 19.2% and was 798,559.
Data-driven conclusions
Overall activity on Binance Smart Chain continues to decline. However, we are seeing a slight increase in the cost of gas on the Binance Smart Chain network – as well as an increase in the total number of unique active wallets.
At the same time, the average number of unique active addresses per day has decreased. Indicators, such as the number of new smart contracts deployed, completed transactions and average blocks per day, continue to decline.
The data suggests that the activity of the BSC network is declining, suggesting a continuation of the bearish trend.