Bearish Signs for BTC Reapper, Will $20K Hold or More Pain Ahead? (Bitcoin Price Analysis)
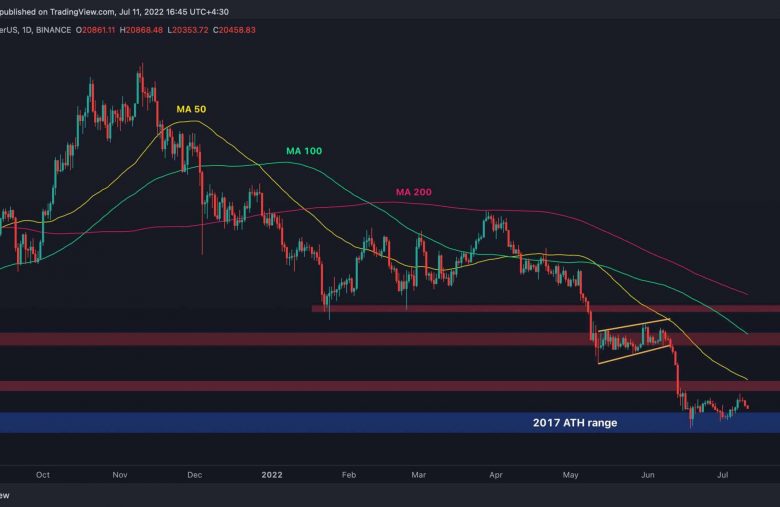
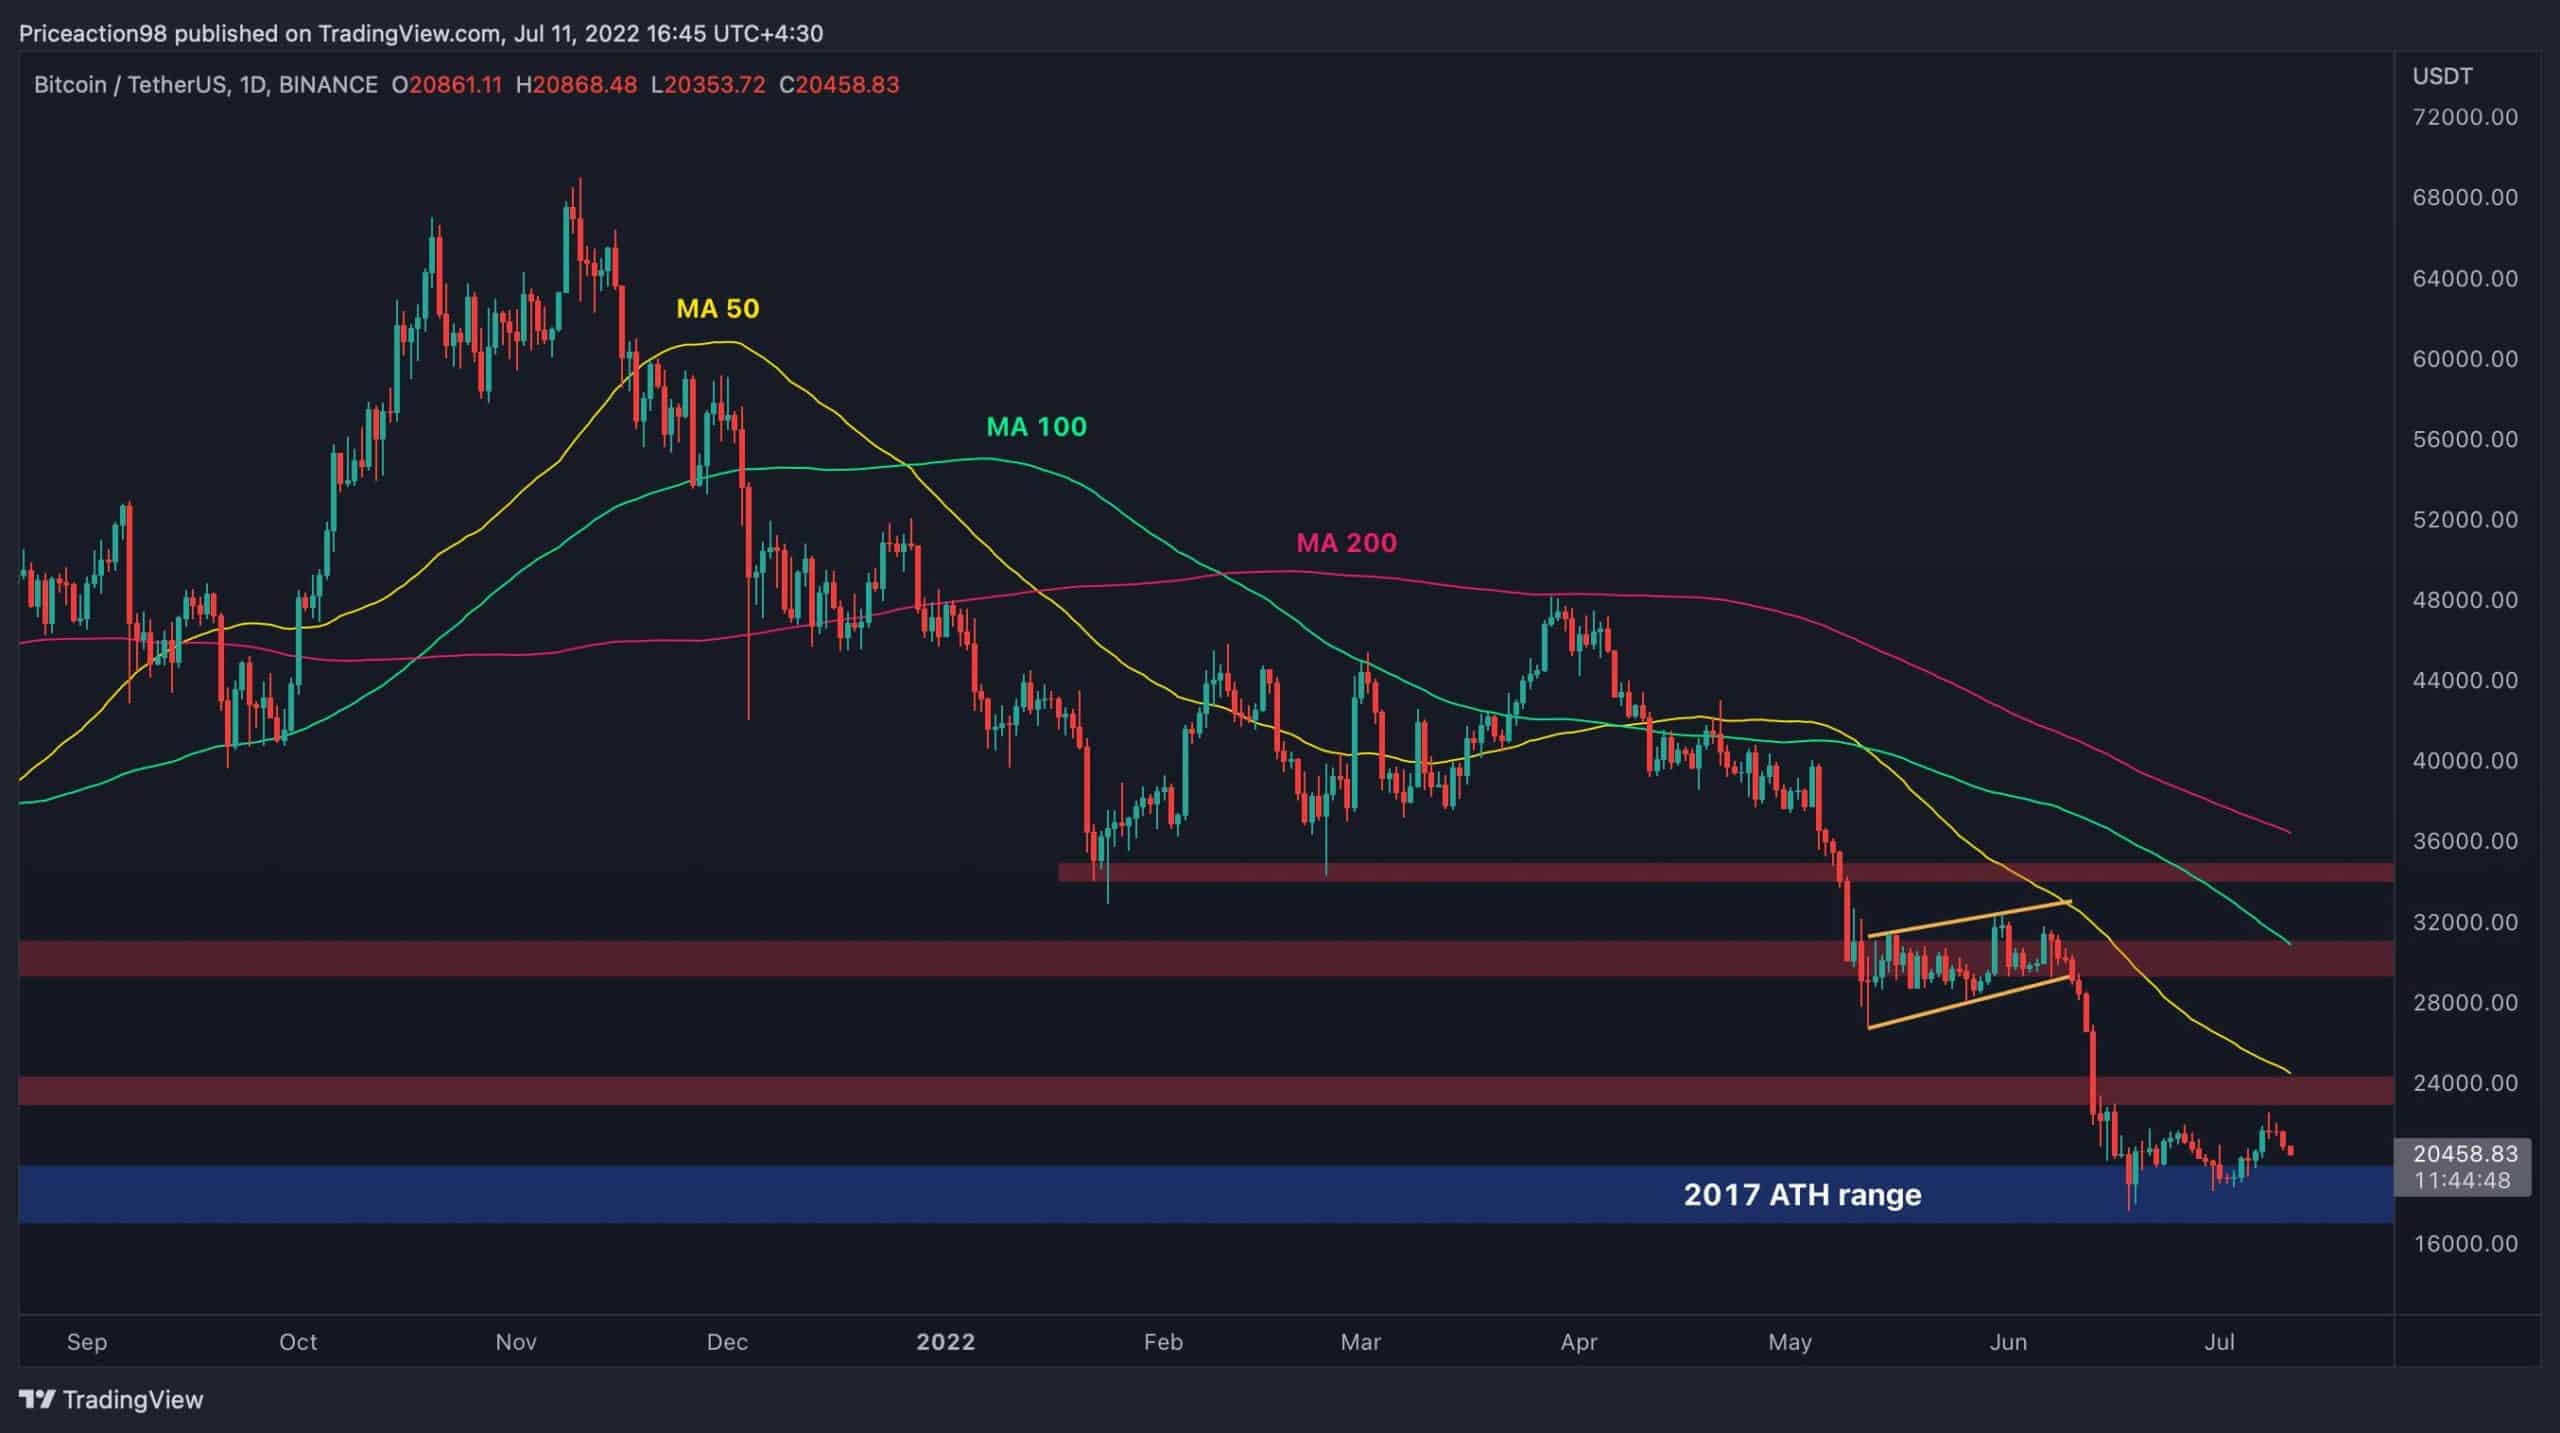
Bitcoin’s price has been consolidating above the 2017 all-time high range of $17K-$20K over the past few weeks, after a sharp decline from the $30K level in June. The price has now rebounded twice from the mentioned support, but it has yet to reclaim the $24K resistance level, which would be the first obstacle to signal a possible bullish reversal.
Technical Analysis
The Daily Chart
The 50-day moving average and the $30K supply zone would be next in line if the price were to break above the $24K level. However, the chart is demonstrating a lack of bullish momentum at the moment, and a third retest and even a potential bearish breakout from the $20K support seems more likely. In this case, the market can experience another freefall and re-visit the $15K area after two years.
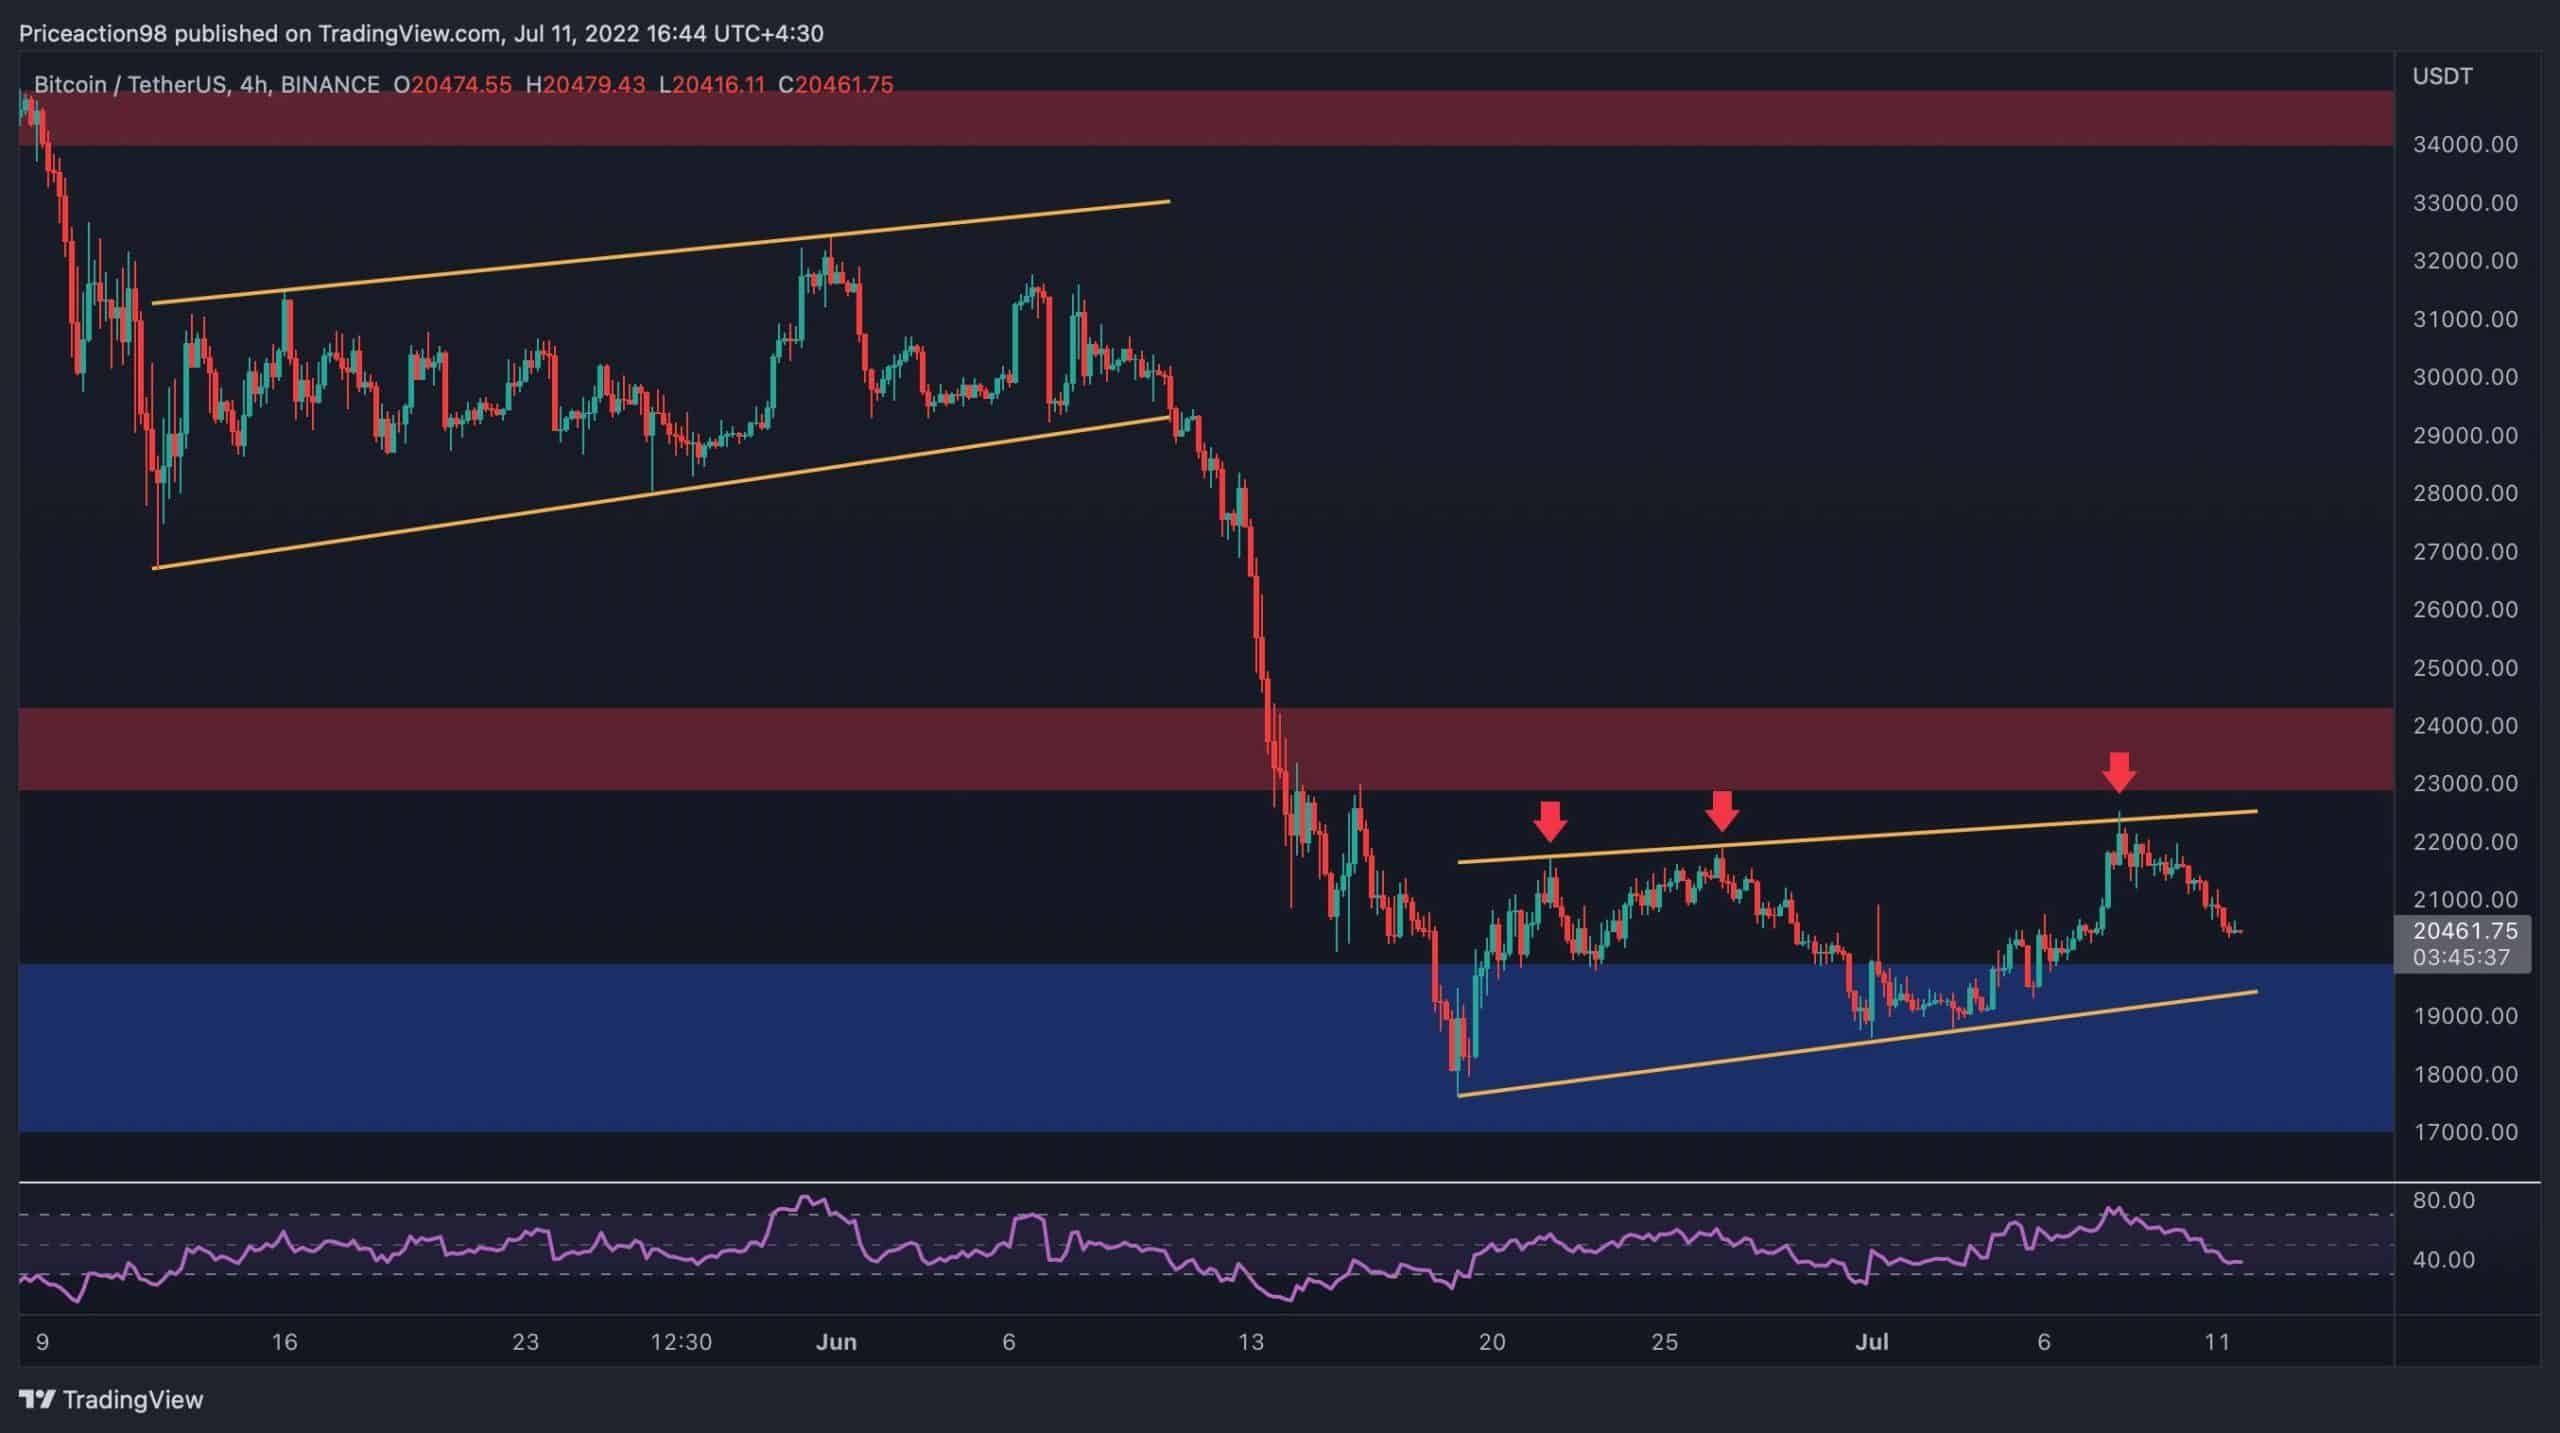
The 4-Hour Chart
On the 4-hour timeframe, the price seems to be forming a bearish flag. This is a negative continuation pattern. If the price successfully breaks it to the downside, another sudden drop and an eventual breakdown of the $17K-$20K area would become more probable. The price has been rejected from the higher trendline of the pattern three times during recent weeks, indicating the higher probability of a pattern validation and further bearish momentum. The RSI indicator has also broken below 50%, pointing to the bears’ dominance over the market in the short-term and boosting the likelihood of a bearish breakout from the flag.
Onchain Analysis
The following chart demonstrates Bitcoin’s Long Term Holder Realized Price alongside its price. LTH realized price measures the average price weighted by the supply of what the long-term holders paid for their coins. It is interpreted as the on-chain support or resistance price.
Historically, a bear market’s bottom has usually formed as the market experiences extreme fear. All market participants enter a capitulation phase, and the weaker hands tend to realize massive losses. However, the whales and long-term holders, players with significant assets and more risk tolerance, are usually the last cohort to enter then losing territory. This stage would mark the final phase of the bear market.
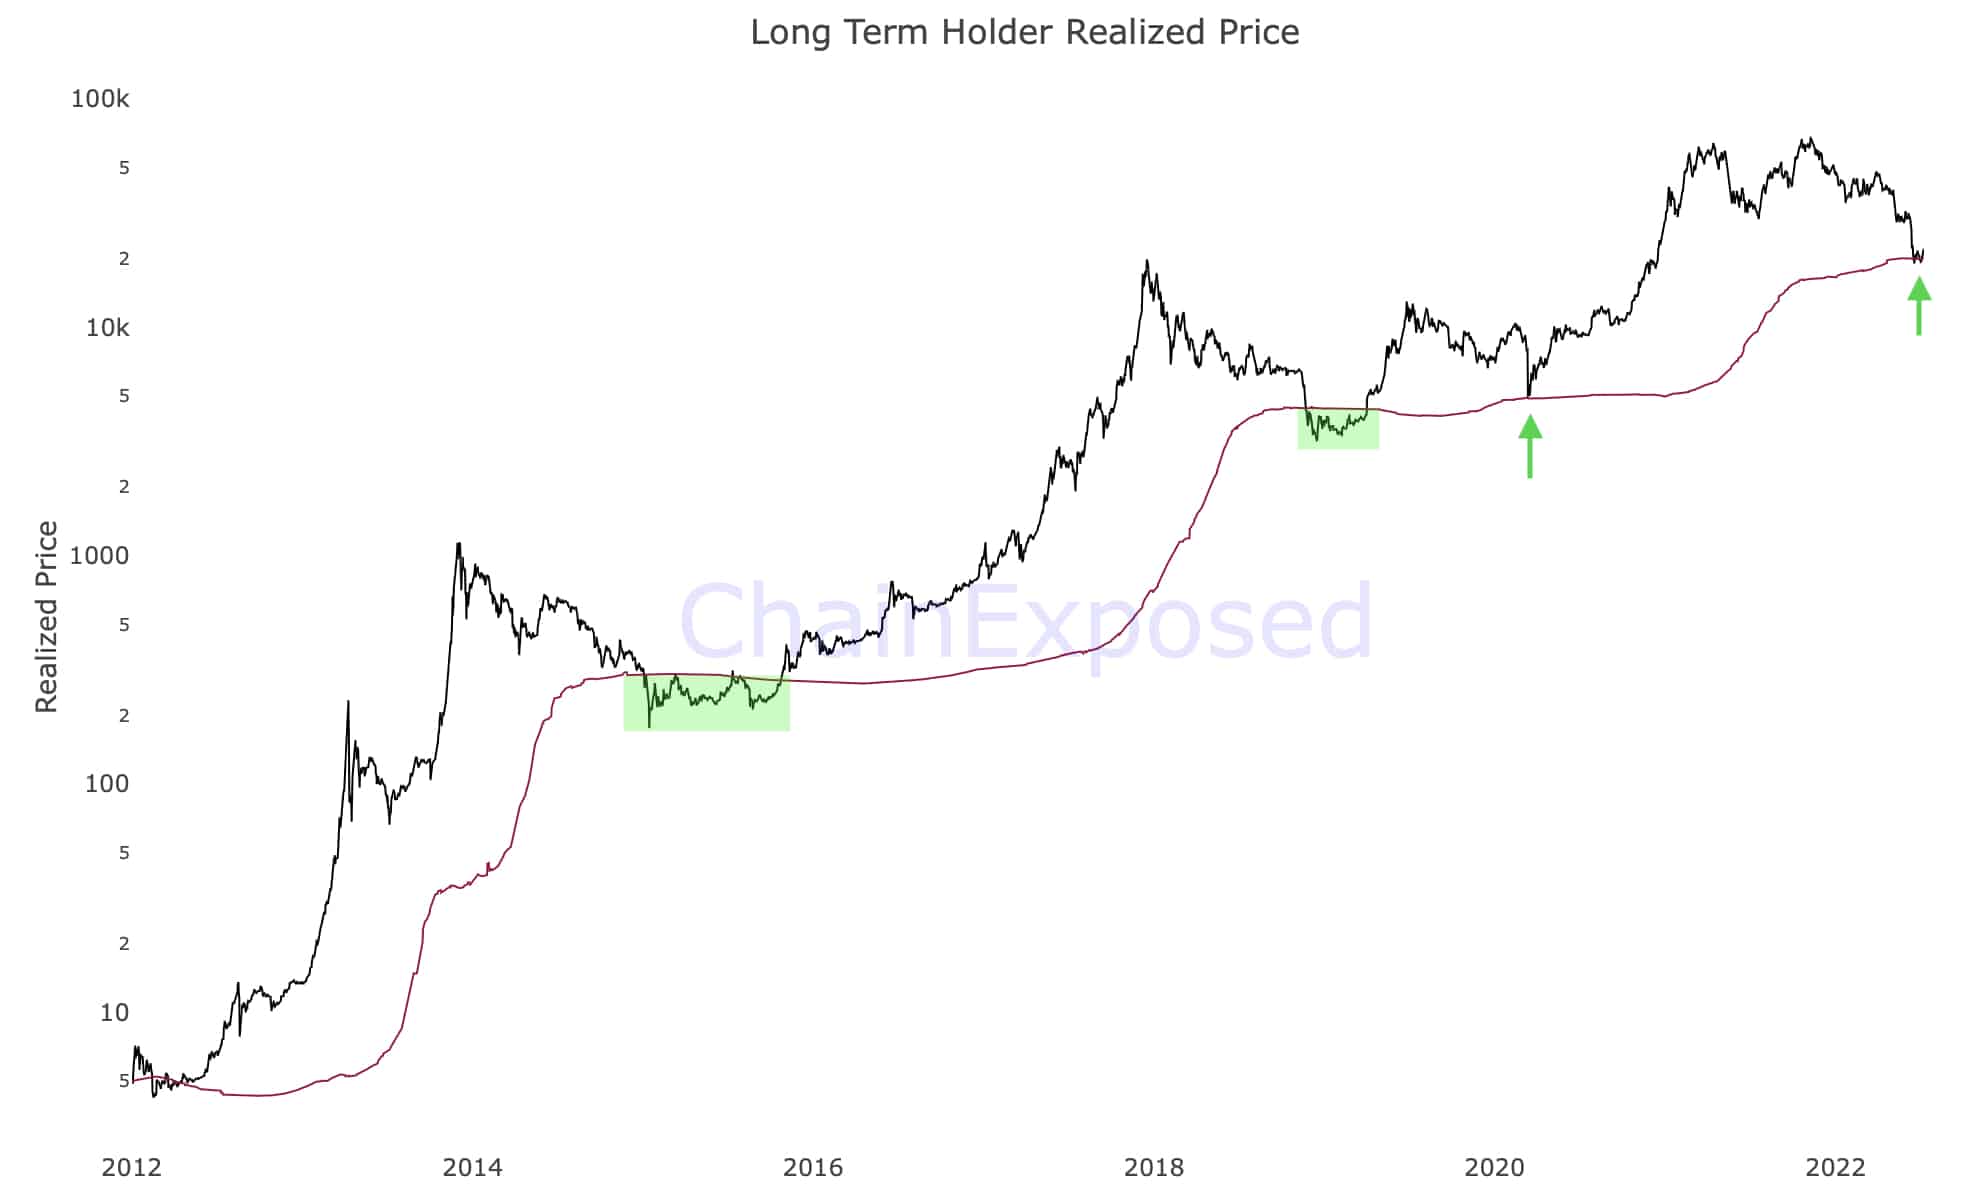
As shown in the following chart, Bitcoin’s price has exceeded the LTH realized price for the third time in its history, indicating that by dropping more than 70% from the $69K all-time high, the long-term holders are now in an aggregate loss. In conclusion, there is a high probability that Bitcoin is close to marking a long-term bottom, as the entire market in total is in an unrealized loss territory which happens extremely rarely.