
- BeInchain presents a compilation of TOP 5 on-chain indicators that may signal the end of the cryptocurrency bear market.
- Net Realized Profit/Loss over market capitalization has reached ATL this year.
- MVRV Z-score indicates extreme undervaluation of BTC price.
In today’s on-chain analysis, we present a ranking of the TOP 5 metrics that indicate the end of the BTC bear market. Although many on-chain indicators were already signaling the bottom in mid-2022, many others were still neutral.
However, as 2022 comes to an end, more and more key indicators seem to be signaling a bottom of Bitcoin price. Our list of TOP 5 on-chain indicators that point to the end of declines included:
- BTC Price Drawdown from ATH
- Percent Supply in Profit
- Net Realized Profit/Loss
- Realized Profits-to-Value
- MVRV Z-score
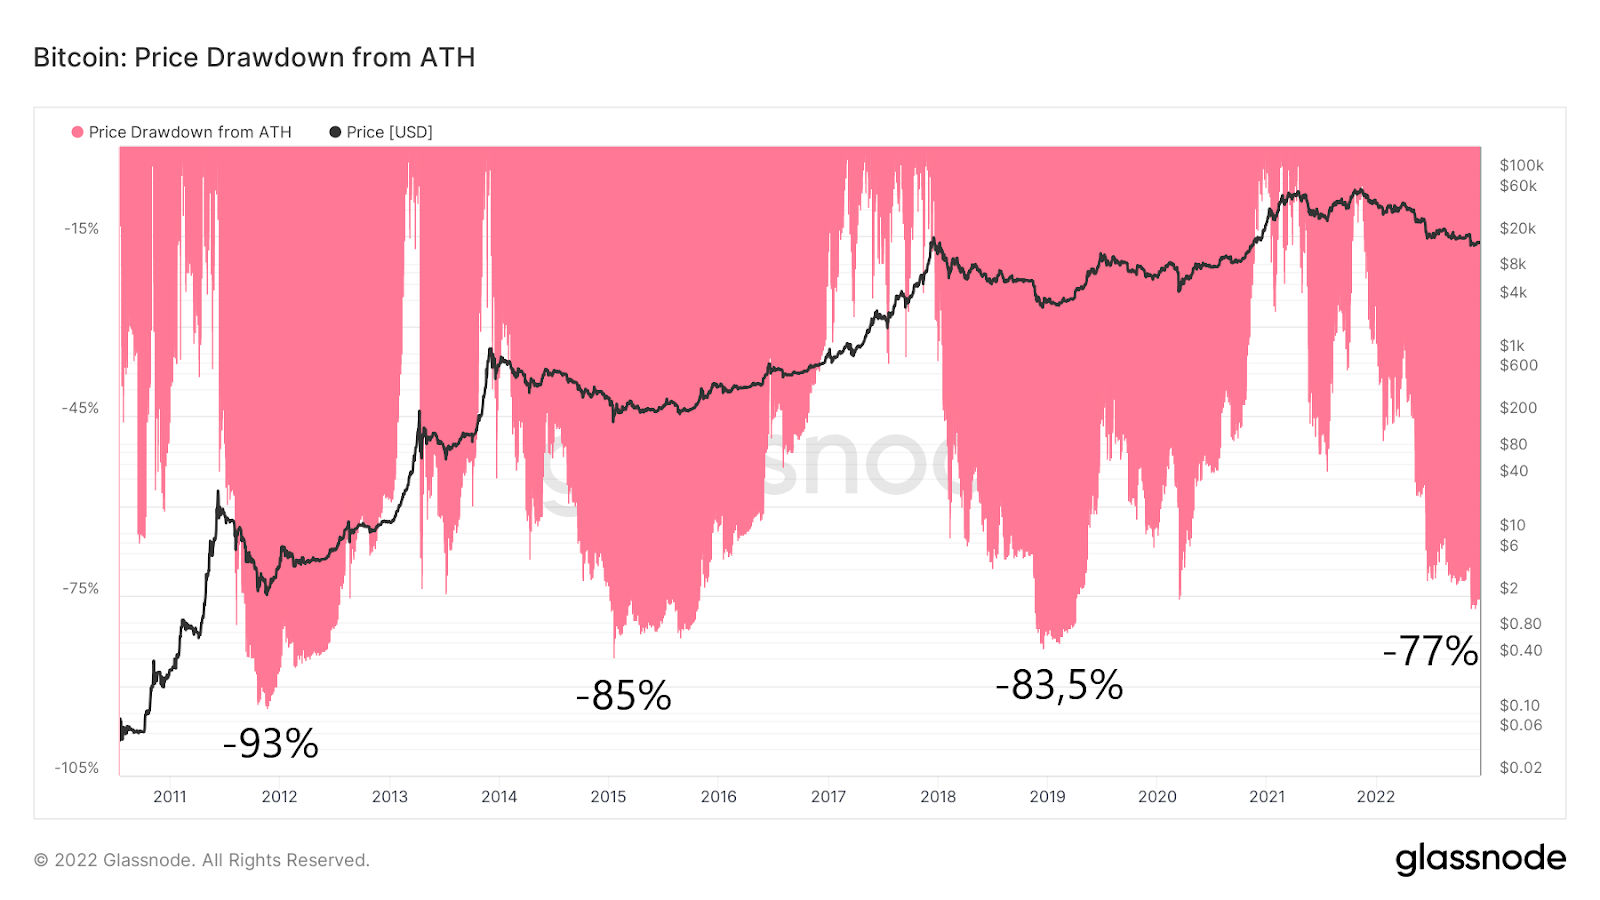
BTC Price Drawdown from ATH
The first of TOP 5 on-chain indicators that suggest Bitcoin has reached the end of the bear market is the Price Drawdown from ATH. It measures the percentage decline in the BTC price from consecutive all-time highs (ATH).
On a long-term chart of this indicator and the Bitcoin price, we see 4 periods in which the Price Drawdown from ATH stayed in extremely low areas. Naturally, they correlate with the ends of historical bear markets and macro bottoms of the BTC price. The lowest points of previous declines were recorded at -93% (2011), -85% (2015) and -83.5% (2018).
Currently, the lowest point of BTC price decline from ATH was recorded at -77% on November 21, 2022. While this is not as low as the bottoms of previous bear markets, we see the depth of declines weakening in subsequent cycles.
In addition, we see that the extreme low deviation from the ATH has persisted for at least several months in the past. Therefore, even if BTC has already reached a macro bottom, we should not expect a quick resumption of the uptrend.
TOP 5 on-chain indicators: Percent Supply in Profit
Another indicator that signals the end of a bear market is Percent Supply in Profit. It shows the percentage of existing coins whose price at the time of the last move was lower than the current price.
On a long-term chart of the 14-day moving average of this indicator, we see that the demarcation line for extreme lows is the level of 50% supply in profit (green area). So far, Bitcoin has been below this line only 5 times. Two times it briefly touched the 48% area, in 2011 and now; similarly, the 50% level during the COVID-19 crash of March 2020 (blue circles).
However, on two occasions the index fell deeper and recorded a bottom at 42%. This happened in the 2015 and 2019 bottoms (red areas). Therefore, depending on which scenario comes true this time, the indicator may have already reached its bottom at 48%, or further declines in the BTC price and the 42% level are on the horizon.

Another way to illustrate the same is to draw the market extremes on the chart. Again, we can see that the current situation more resembles the declines of 2011 and the crash of 2020, rather than the 2 previous bear markets.

Net Realized Profit/Loss
The third in our list of TOP 5 on-chain indicators is Net Realized Profit/Loss. It is defined as the net profit or loss of all moved coins expressed in dollars (USD). In other words, it is the simple difference between realized profit and realized loss.
The dollar valuation of Bitcoin in the current market is so high that the net realized profit/loss ratio is at its lowest levels ever. It reached the all-time low (ATL) of -$4.30 billion on November 18, 2022. Previous records were set on June 13, 2022 (-$4.23 billion) and June 25, 2021 (-$3.46 billion).
Comparing these extremes to the previous bear market or even the COVID-19 crash, we note that the realized net profit/loss was much milder. On March 12, 2020, the ratio hit a bottom at -$1.39 billion. In contrast, the bottom of the previous bear market was only -$948 million on December 5, 2018.

However, if one were to normalize the realized net profit/loss by market capitalization, we see that the lowest level was reached during the June declines. At that time, the ratio reached the ATL of -6.22%. By comparison, in historical bear markets it fell to -6.00% in January 2015 and -5.39% in December 2018.

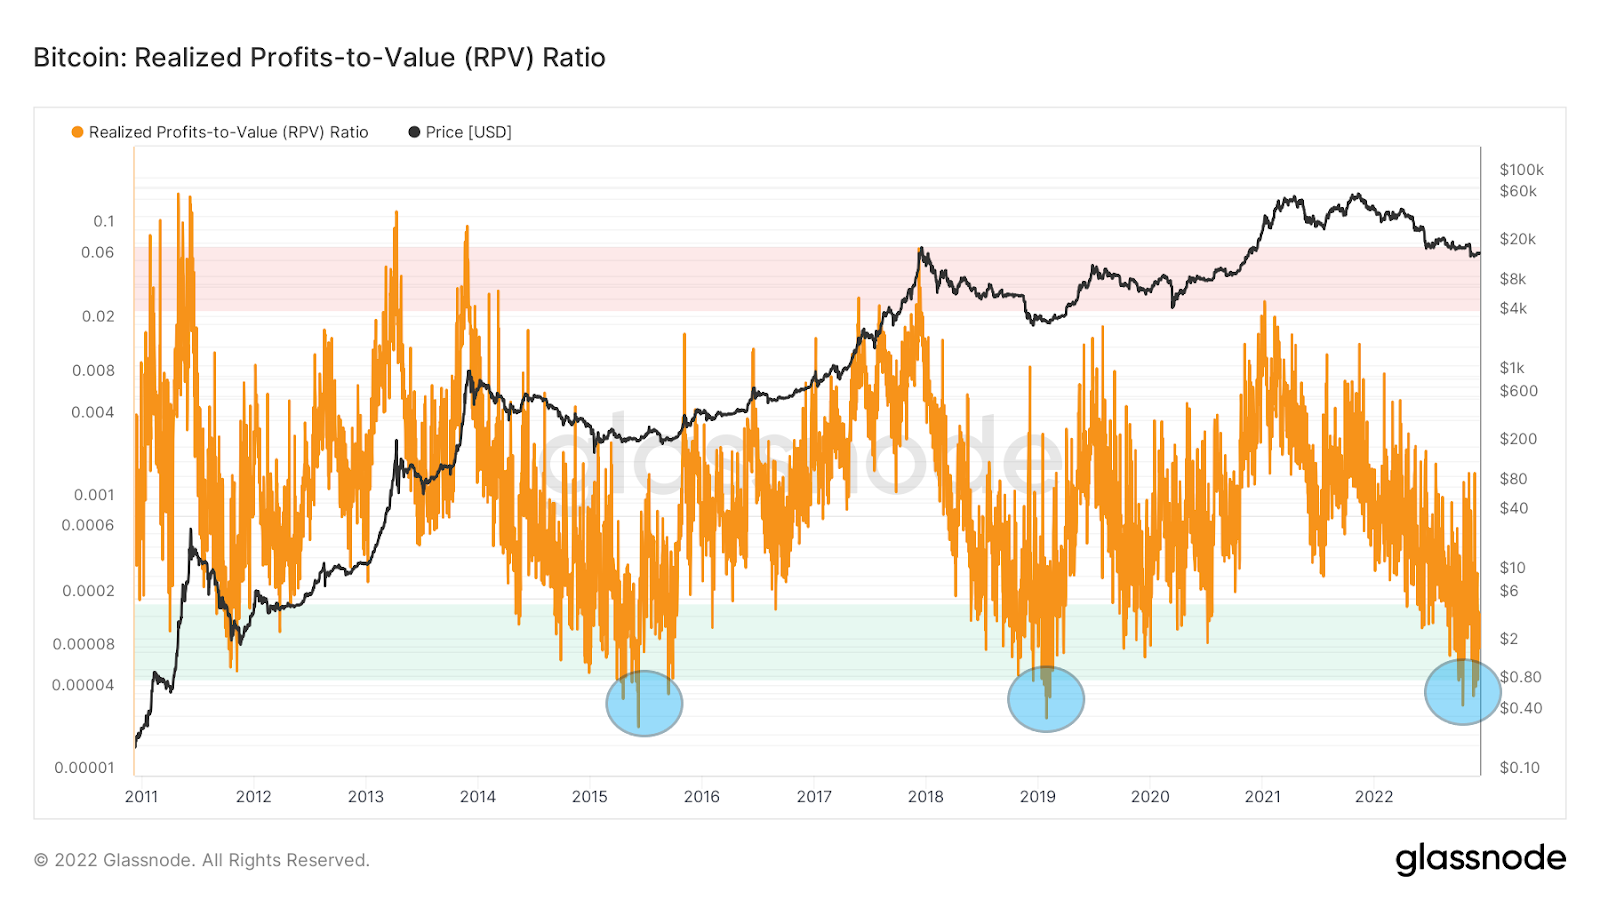
Realized Profits-to-Value
Another interesting indicator is the Realized Profits-to-Value (RPV) ratio. It is defined as the ratio of realized profits to realized market capitalization. This metric compares the market’s profit realization to its overall dollar-for-dollar cost basis.
According to data from Glassnode, the green area between the levels of 0.00005 and 0.00017 signals good opportunities for Bitcoin buys. However, in exceptional situations, the indicator even falls below this area and signals excellent buying opportunities.
So far, this has happened only three times in history – in 2015, in 2019 and now (blue areas). What’s more, on the two previous occasions, these extreme lows occurred after the BTC price had already bottomed out. If this were to happen again now, it is possible that Bitcoin has already reached the bottom of this bear market.
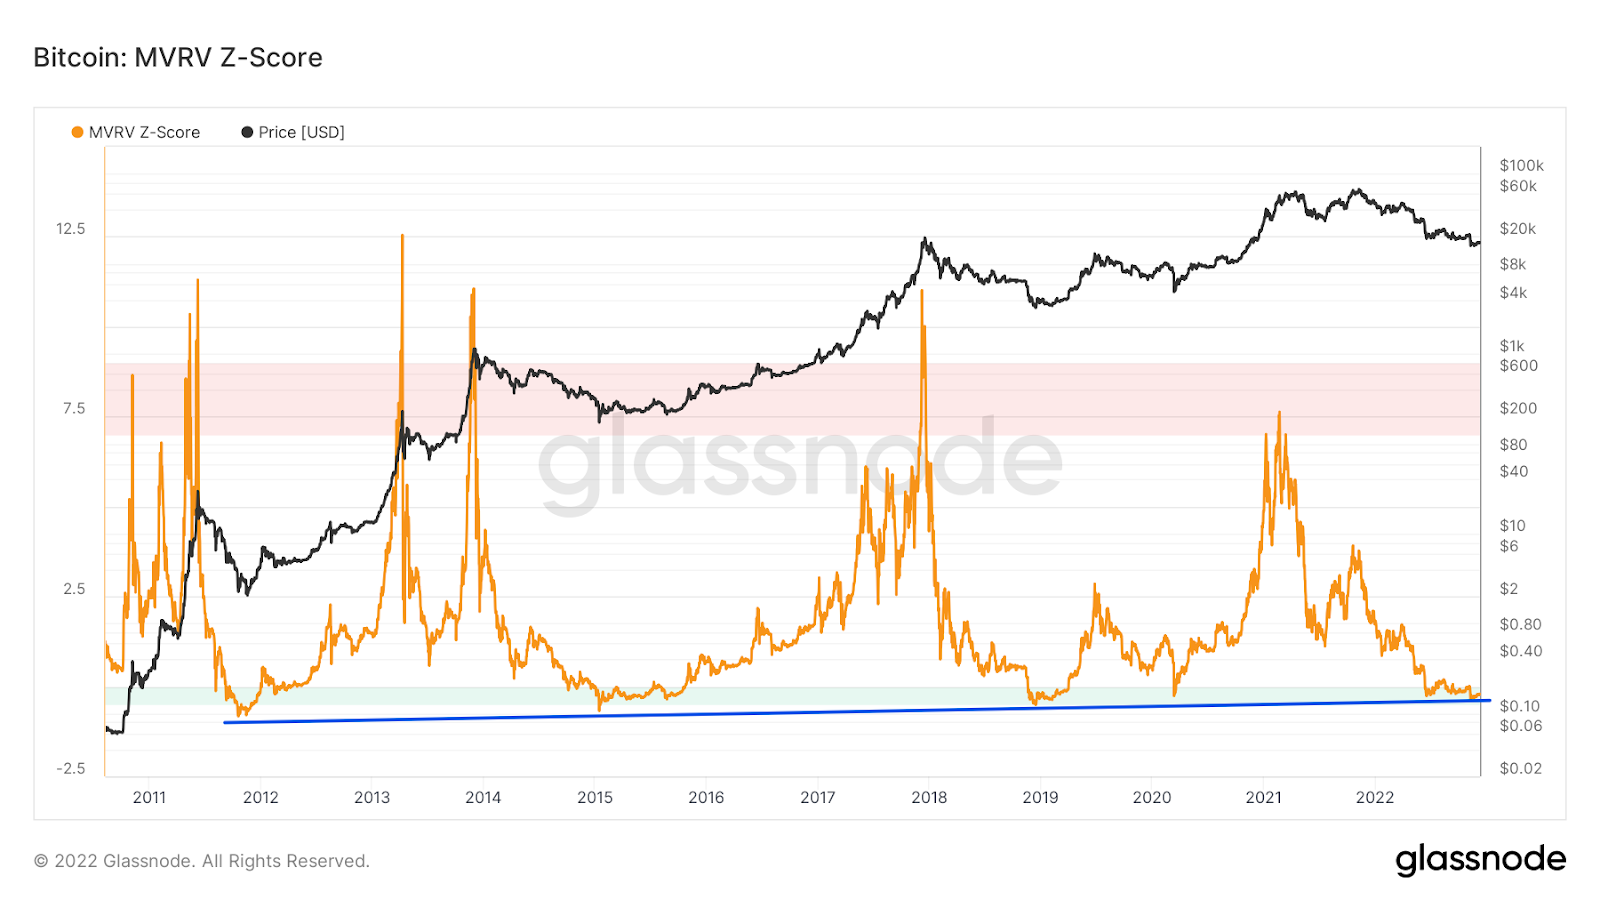
TOP 5 on-chain indicators: MVRV Z-score
The last on the list of TOP 5 on-chain indicators that signal a bottom in the price of BTC is the well-known MVRV Z-score. In short, it is used to assess when Bitcoin is overvalued or undervalued relative to its so-called “fair value”. It is calculated as the ratio of the difference between the market value and realized value, and the standard deviation of all historical market value data.
On the long-term chart, we can see that whenever the MVRV Z-score was in the green area, it was a very good signal of a bottom in Bitcoin price. The capitulation of the indicator has always correlated with the capitulation of the BTC price.
Moreover, we see that each successive bear market led the MVRV Z-score to slightly smaller extremes. This allows us to draw a rising support line (blue), where the indicator is currently located. If it holds, it is possible that Bitcoin has already reached the bottom of the current bear market.
To further understand the relevance of the MVRV Z-score to the health of the cryptocurrency market, you can overlay the colors representing it on a Bitcoin chart. This gives an indication of an overvalued (red, overheated) or undervalued (green, overcooled) market. According to this metric, the current Bitcoin price in the $16-20k range appears to be extremely undervalued.