Binance Coin Analysis: BNB Sets Fresh ATH Above $400 Following 40% Weekly Surge

BNB/USD – Bulls Set New ATHs Above $400
Key Support Levels: $380, $350, $325.
Key Resistance Levels: $400, $410, $441.50.
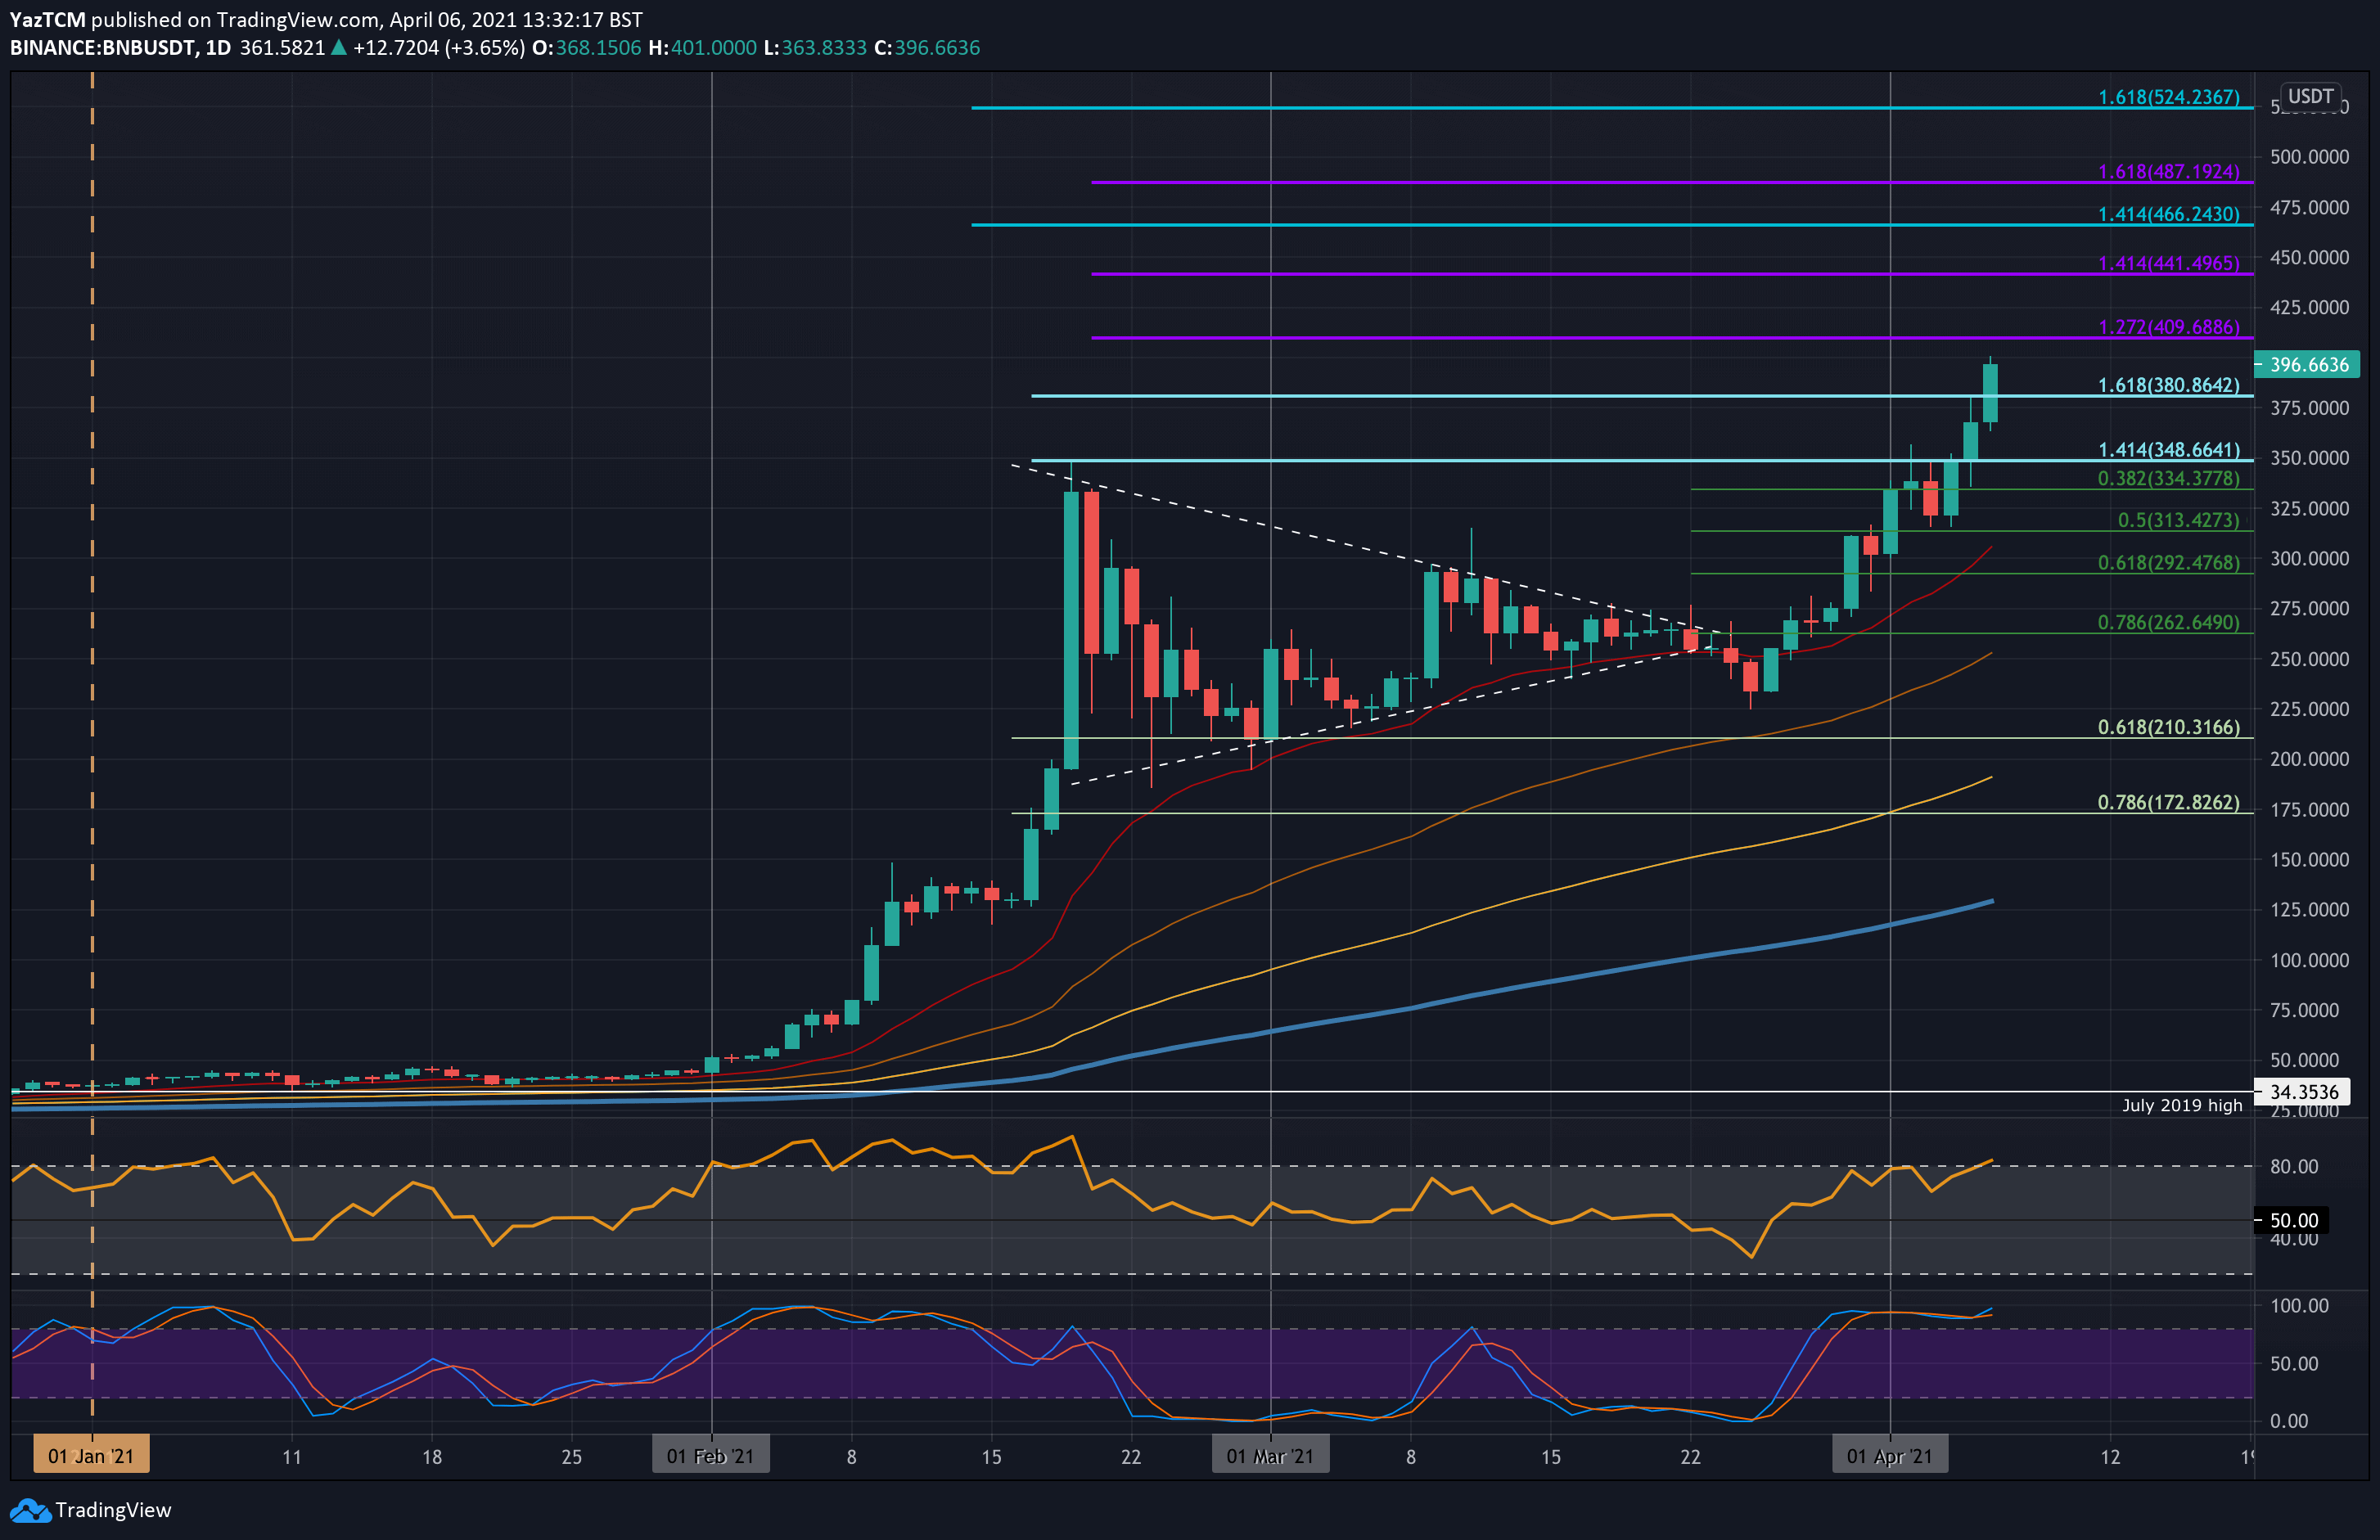
Binance Coin is up by a total of 40% over the past week, allowing it to set a new all-time high price at $401. The cryptocurrency found support at $320 after struggling to break resistance at $348.66 (1.414 Fib Extension) earlier in the week.
This level was finally penetrated yesterday, which allowed BNB to rise into the $380.86 resistance (1.618 Fib Extension). Today, BNB had pushed higher to scratch above $400 briefly before falling back beneath it to the current $396 level.
BNB-USD Short Term Price Prediction
Moving forward, the first level of resistance lies at $400. This is followed by $410 (1.272 Fib Extension – purple), $441.50 (1.414 Fib Extension – purple), and $466.25.
On the other side, the first level of support lies at $380. This is followed by $350, $325 (.382 Fib), $305 (.5 Fib & 20-day EMA), $300, and $286.67 (.618 Fib).
The RSI has now penetrated into extremely overbought conditions as the bullish momentum increases. However, the momentum was higher during February, suggesting BNB still has room for growth before the bull run slows down.
BNB/BTC – Buyers Break 2021 Highs
Key Support Levels: 0.0065 BTC, 0.0063 BTC, 0.006 BTC.
Key Resistance Levels: 0.00671 BTC, 0.007 BTC, 0.00731 BTC..
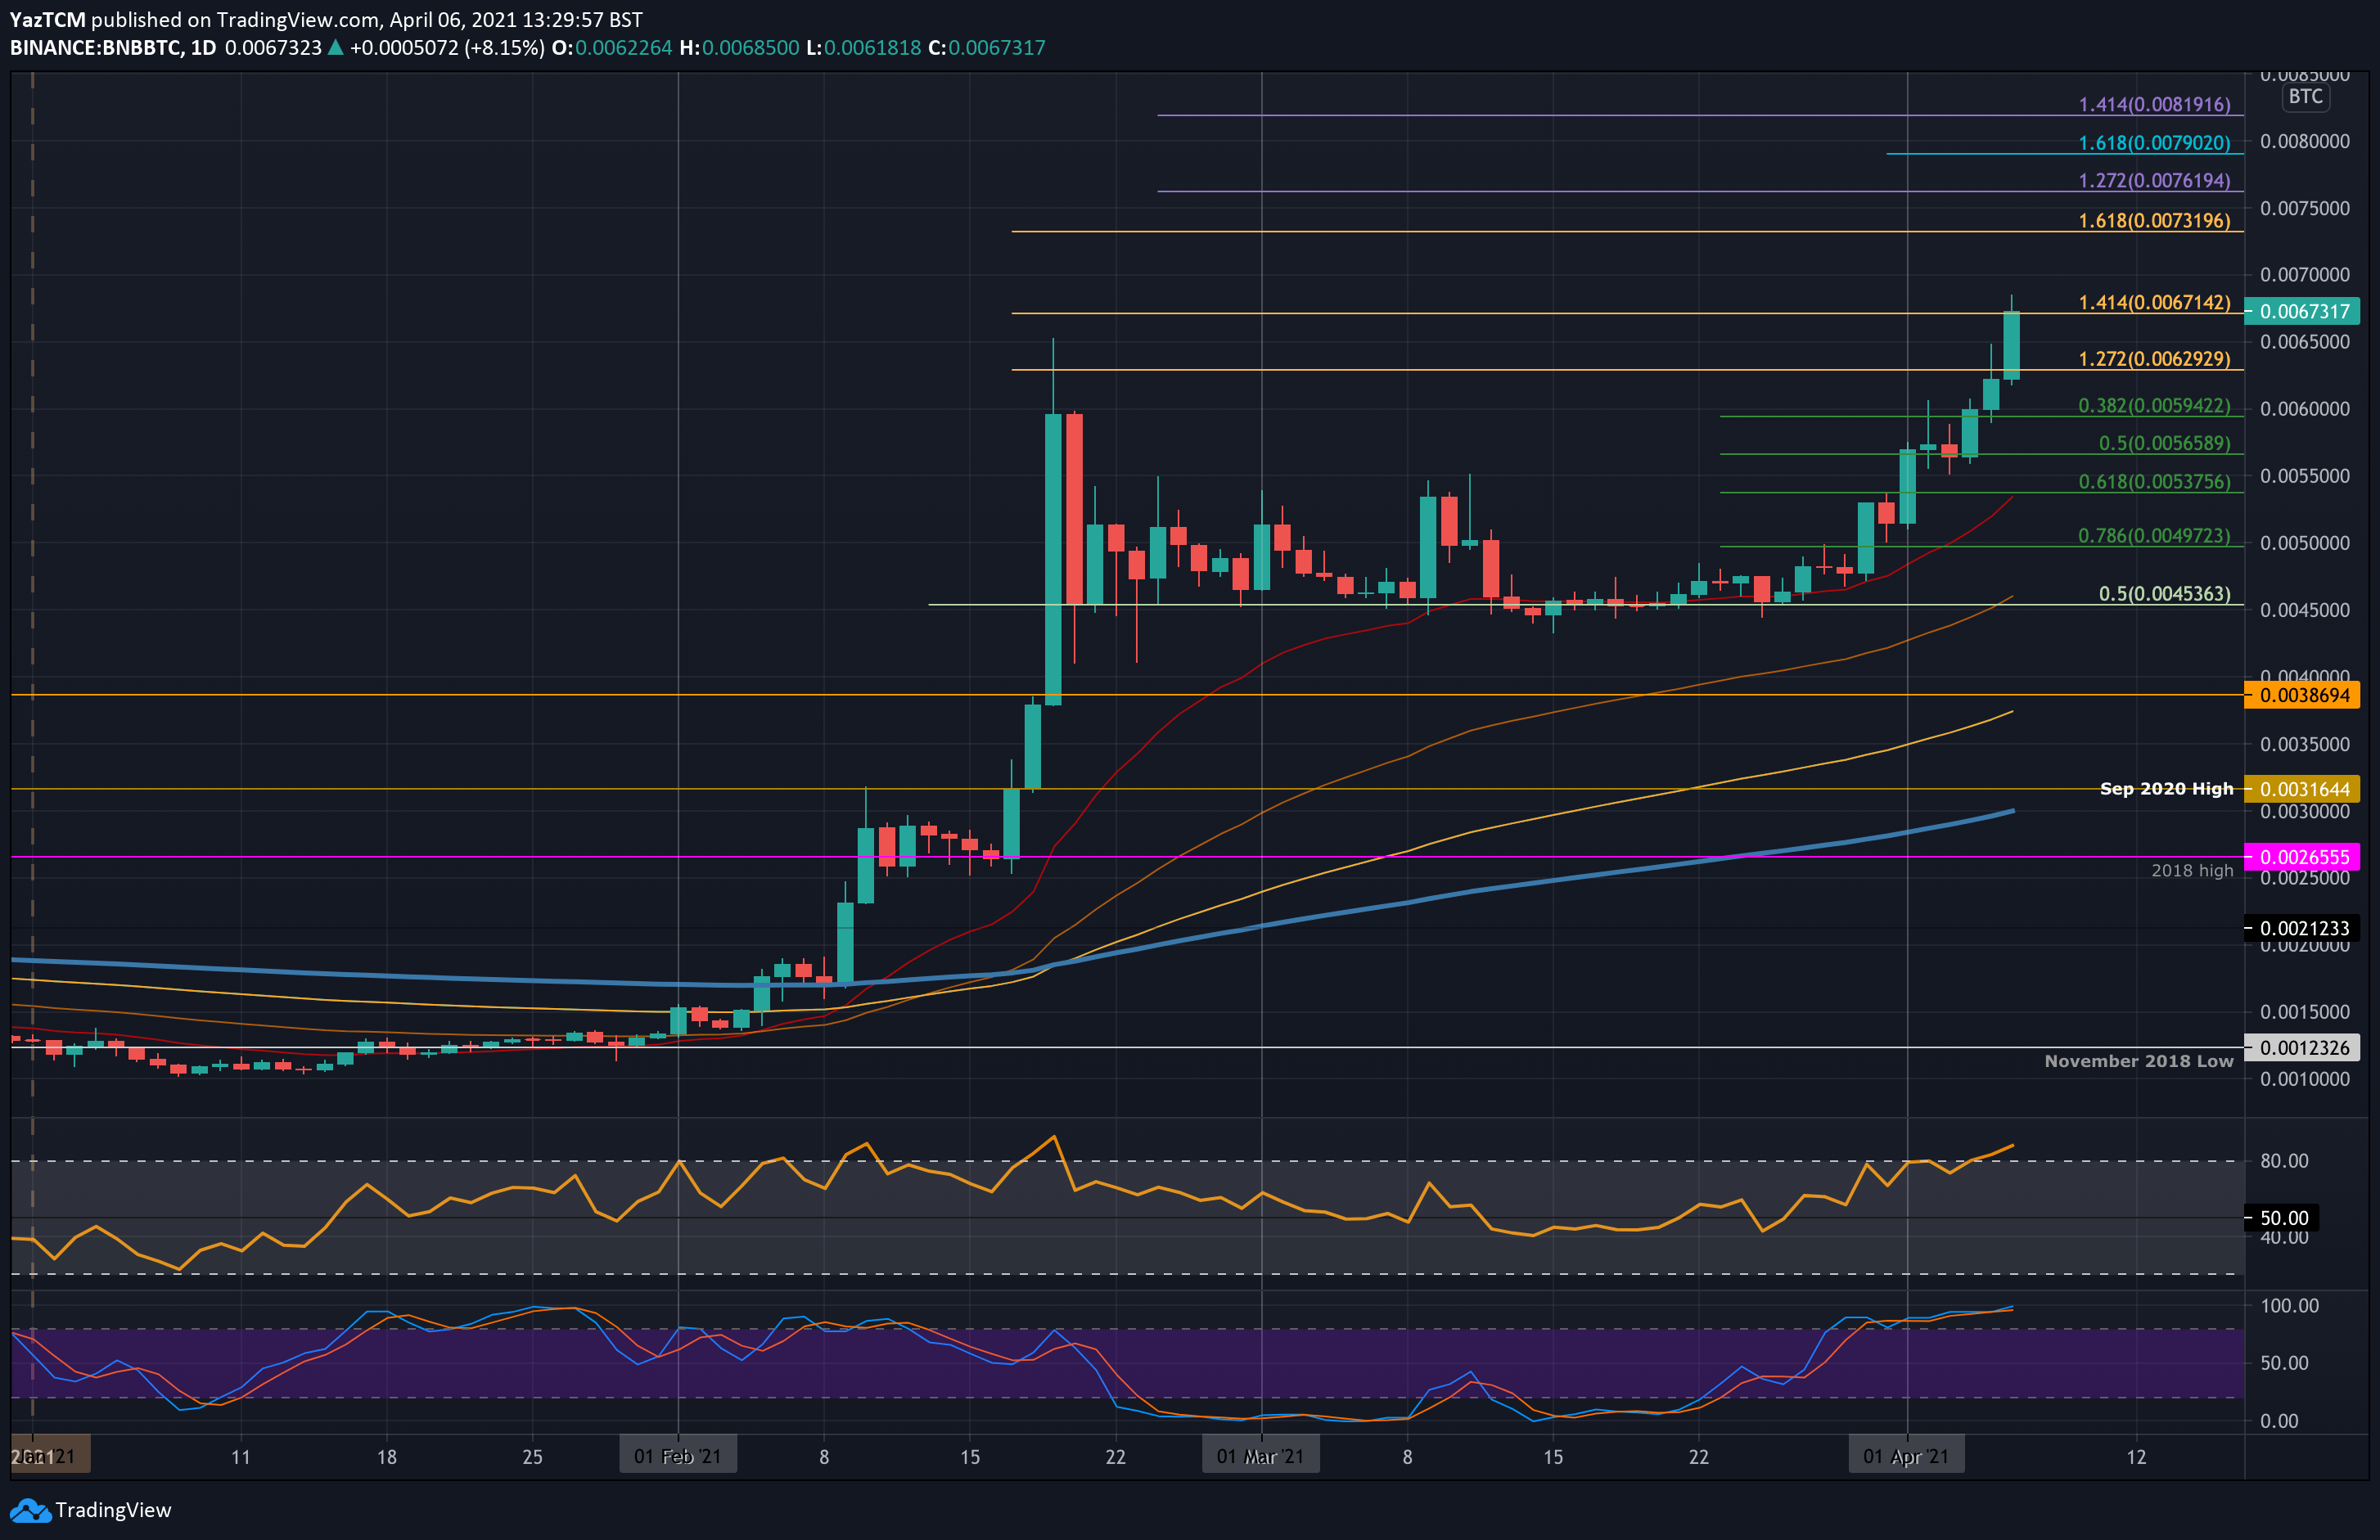
Against Bitcoin, BNB is also pushing higher from the support at 0.0055 BTC it found at the start of the month. It managed to break resistance at 0.006 BTC yesterday, and it continued higher above the February highs at 0.0065 BTC to set a new 2021 high at 0.00685 BTC today.
The cryptocurrency has dropped slightly as it now trades at 0.00671 BTC, which is resistance provided by a 1.414 Fibonacci Extension level.
BNB-BTC Short Term Price Prediction
Looking ahead, the first level of resistance lies at 0.00671 BTC (1.414 Fib Extension). Above this, resistance lies at 0.007 BTC, 0.00731 BTC (1.618 Fib Extension), 0.0075 BTC, and 0.0079 BTC.
On the other side, the first level of support lies at 0.0065 BTC. This is followed by 0.0063 BTC, 0.006 BTC, 0.00577 BTC (.382 Fib), 0.00552 BTC (.5 Fib), and 0.00527 BTC (.618 Fib & 20-day EMA).
The RSI is in overbought territory and is approaching the momentum peak that was seen during February. This suggests the buyers might be a little overextended right now.


