Bitcoin Price Analysis: BTC At 11-Day Low, is $30K Retest Incoming?

Bitcoin is down by a sharp 5% today as the primary cryptocurrency violently breaking down support at $35K. As of now, bitcoin is trading at its lowest price range since June 9.

Just five days after things started to look short-term bullish, as BTC surged above the 20-day MA to reach resistance located at $40,760 (bearish .382 Fib), Bitcoin about to conclude another bearish week.

The bigger picture hadn’t changed – since the May-19 huge liquidation crash, Bitcoin price is trading inside a choppy zone between $30K and $42K. Tuesday’s daily candle, which recorded a high of $41.3k, had quickly turned into a bull trap. Since then, BTC’s price lost almost $8K.

Looking at the smaller timeframe, BTC could not break above the upper boundary of the range ($42K) and quickly lost momentum. On Friday, it broke beneath the 20-day moving average line and then headed beneath $36,000. In doing so, BTC also broke down the lower angle of a rising wedge pattern (mostly textbook bearish) that we were tracking over the past week, and can be clearly seen on the following short-term’s 4-hour chart.

Since breaking beneath the wedge, the bulls attempted to defend the $35,000 support. However, this level couldn’t resist, as of writing these lines, and BTC is trading close to $33k.

What is important to note is that the recent price drops are occurring on lower trading volumes compared to May’s trading volume levels.

According to data from leading exchanges as can be seen below, the commutative volume has steadily remained beneath 50K BTC since the start of June. This is much lower than the ~150K BTC levels that were common around the mid-May capitulation. Low volume – no interest and market that can easily shift.

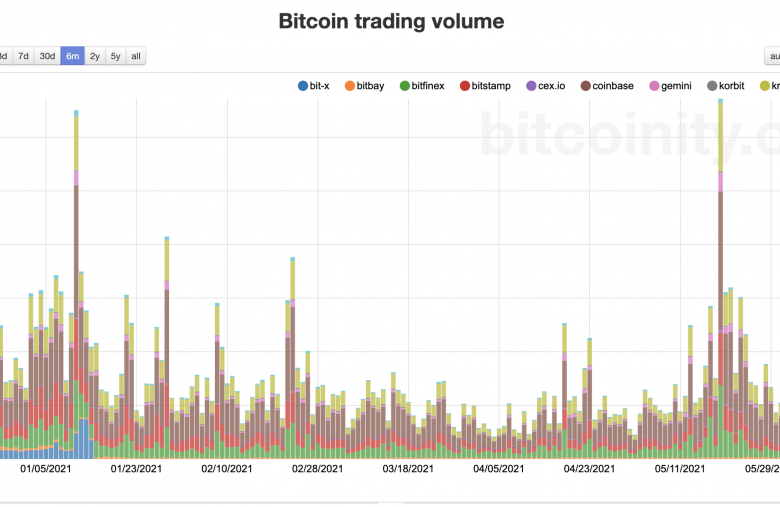
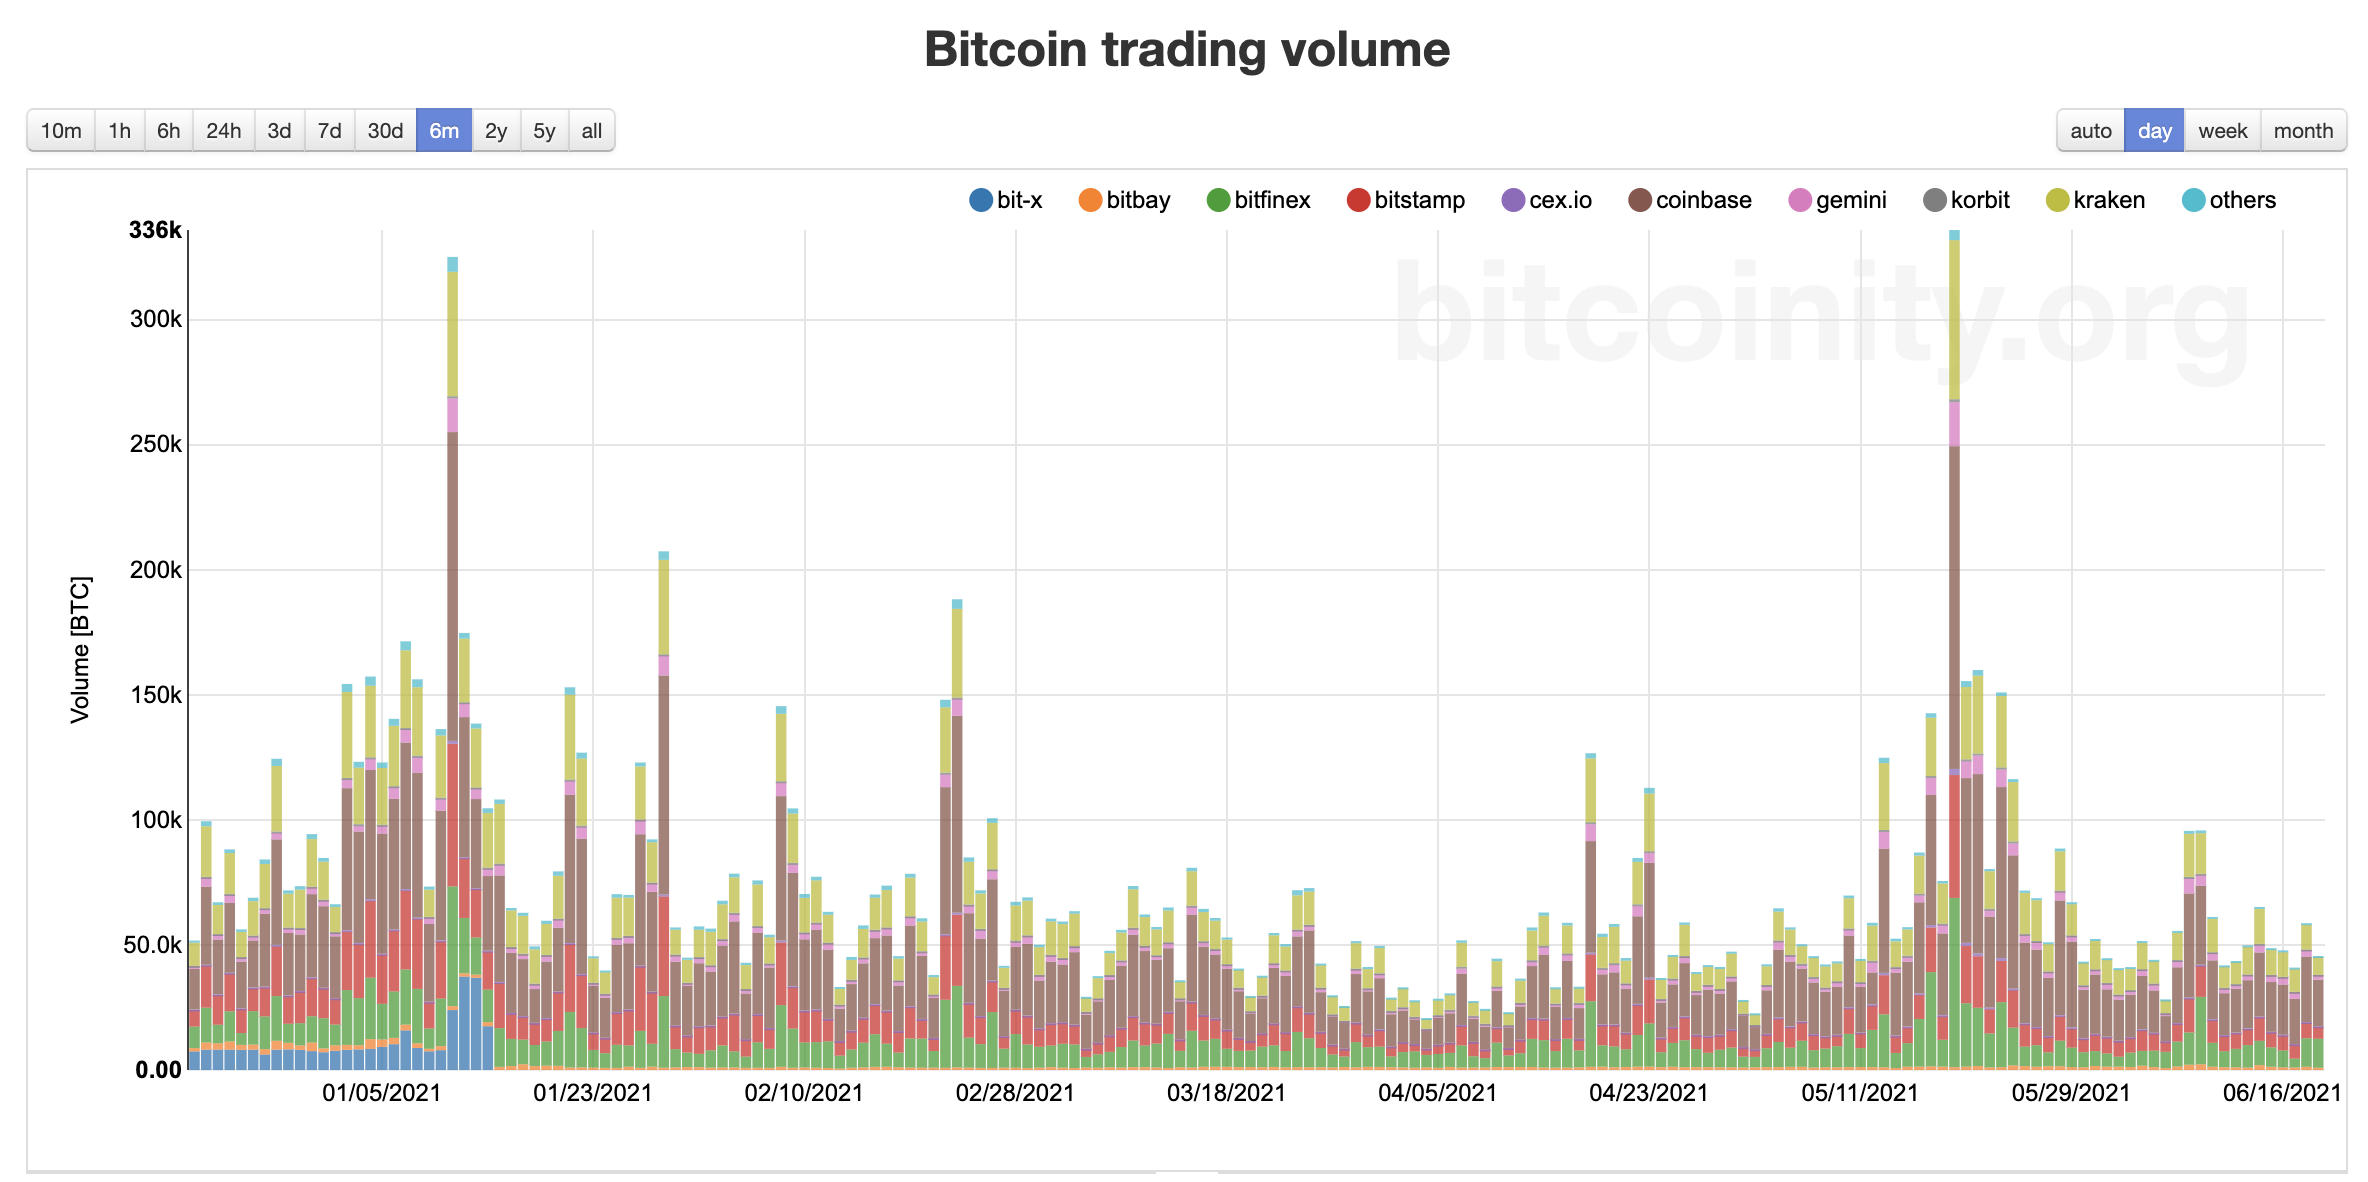
BTC Cumulative Volume. Source

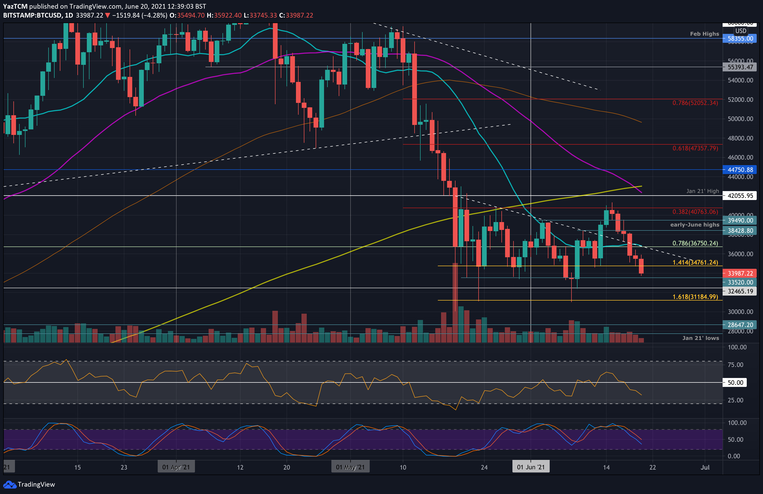
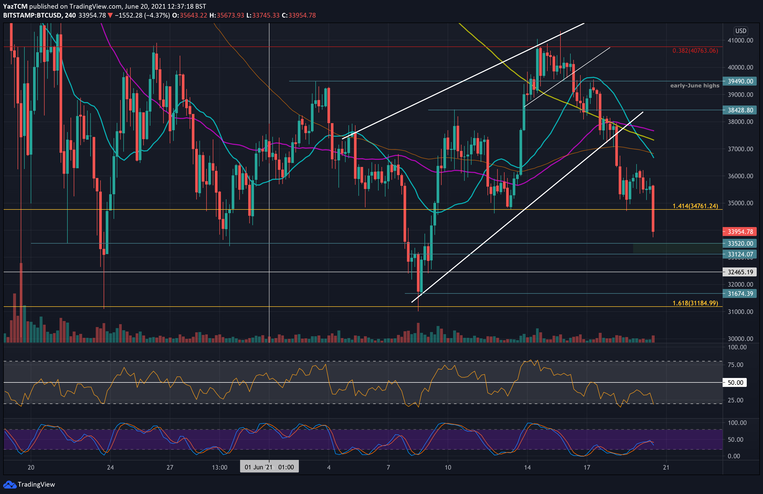
Looking forwards, the recent breakdown beneath $34,000 might send BTC for another retest of the lower range of the mid-term trading zone, or in other words – toward $30,000.

As mentioned above, BTC has been trading inside the wide trading range between $30,000 and $42,000 for a total of 32 days so far. BTC Is likely to remain choppy until a clear breakout of this range takes place.

BTC Price Support and Resistance Levels to Watch

Key Support Levels: $33,520 – $33,120, $32,465, $31,675, $31,000, $30,000.

Key Resistance Levels: $35,000, $36,000, $36,750, $38,420, $39,500.

Looking ahead, the first support zone lies between $33,520 and $33,120, this range saw a lot of price action over the past month. Beneath $33,000, support is expected at $32,465, $31,675, $31,000, and $30,000.

On the other side, the first resistance now lies at $35,000. This is followed by $36,000, $36,750 (20-day MA), $38,420, and $39,500 (early-June Highs).

The daily RSI is in the bearish favor as it sits deep beneath 50. The momentum is now approaching the most oversold for June, and a break beneath the June low (around 30) is likely to send BTC back to $30K.

Bitstamp BTC/USD Daily Chart

BTC/USD Daily Chart. Source: TradingView.

Bitstamp BTC/USD 4-Hour Chart

Leave a Reply