Bitcoin Price Analysis: BTC Sees 5th Rejection Of $60k, What’s Next?

Let’s start with some good news: despite dropping by 2.7% today, Bitcoin’s price is still up by 3% over the past week, as of writing these lines.
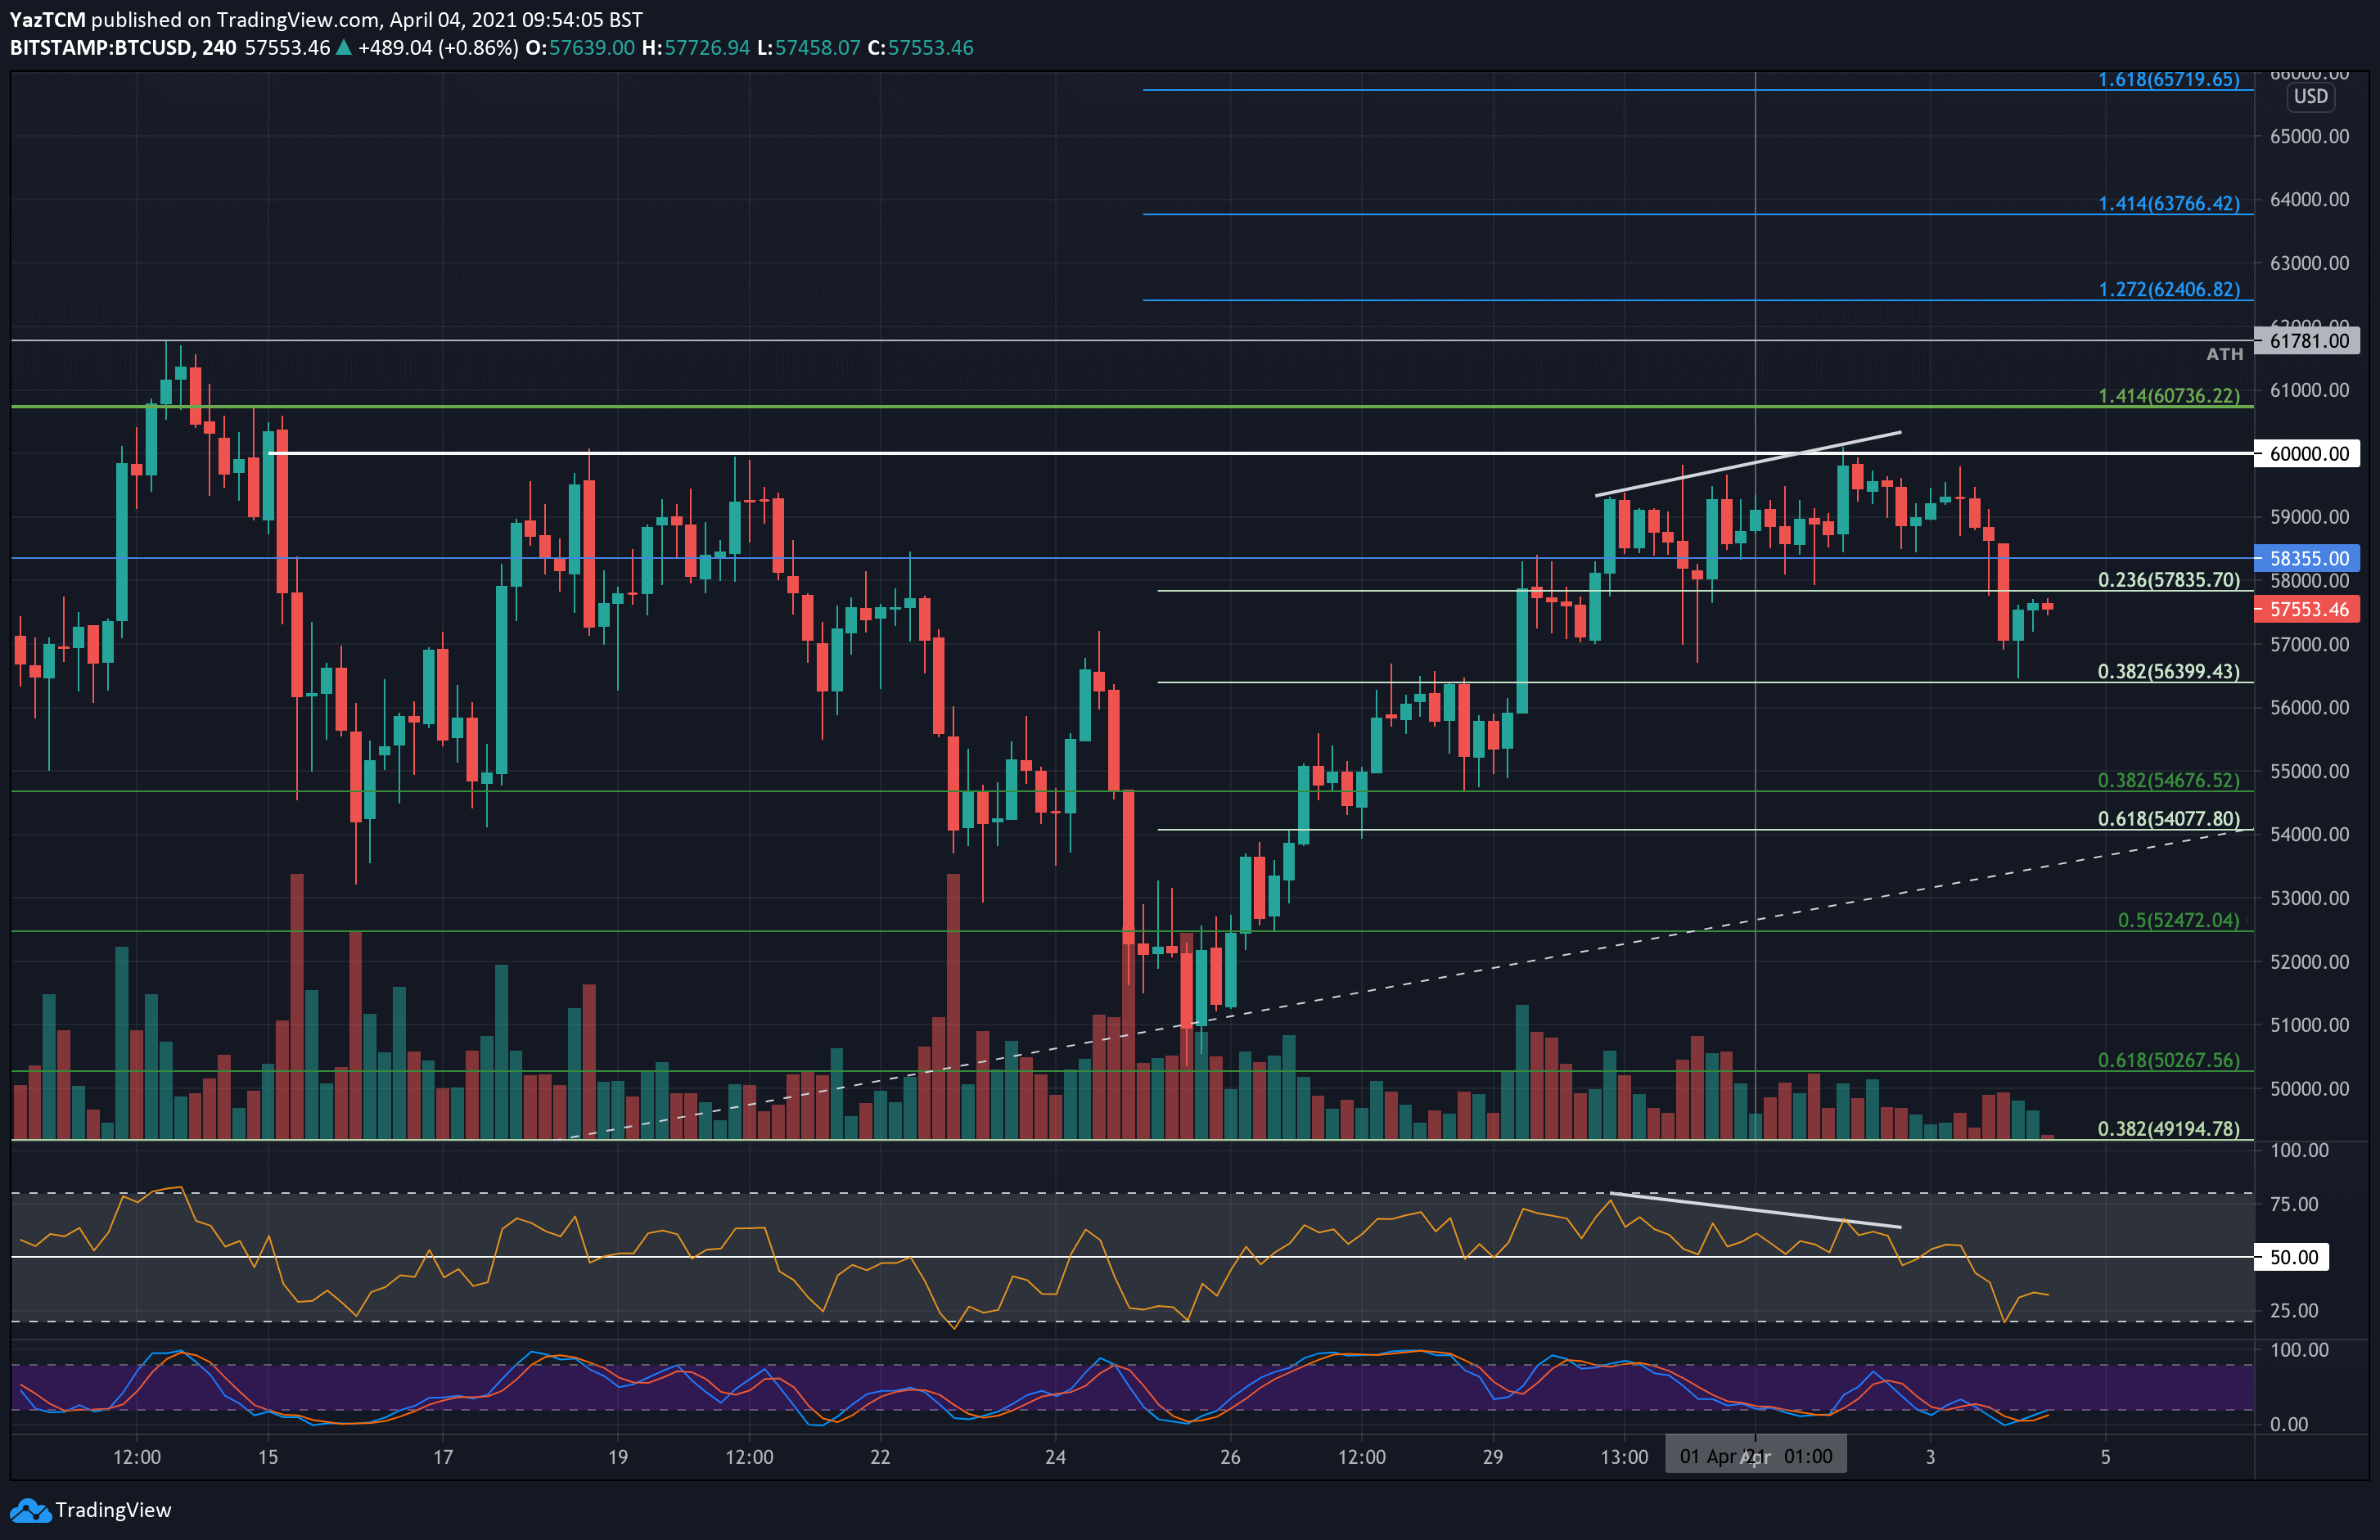
A quick recap: the primary cryptocurrency started the month of April by attempting to push above the $60,000 level, this was the fourth attempt since March 18. Unfortunately, it got rejected once again, and over the past hours lost around $3500, reaching as low as $56.5k on Bitstamp.
There, it met short-term support at the .382 Fib. This support was further bolstered by the 20-day moving average line (and maintained on a 4-hour timeframe unless there will be last-minute surprises). This is the same supporting line Bitcoin bottomed at on Wednesday.
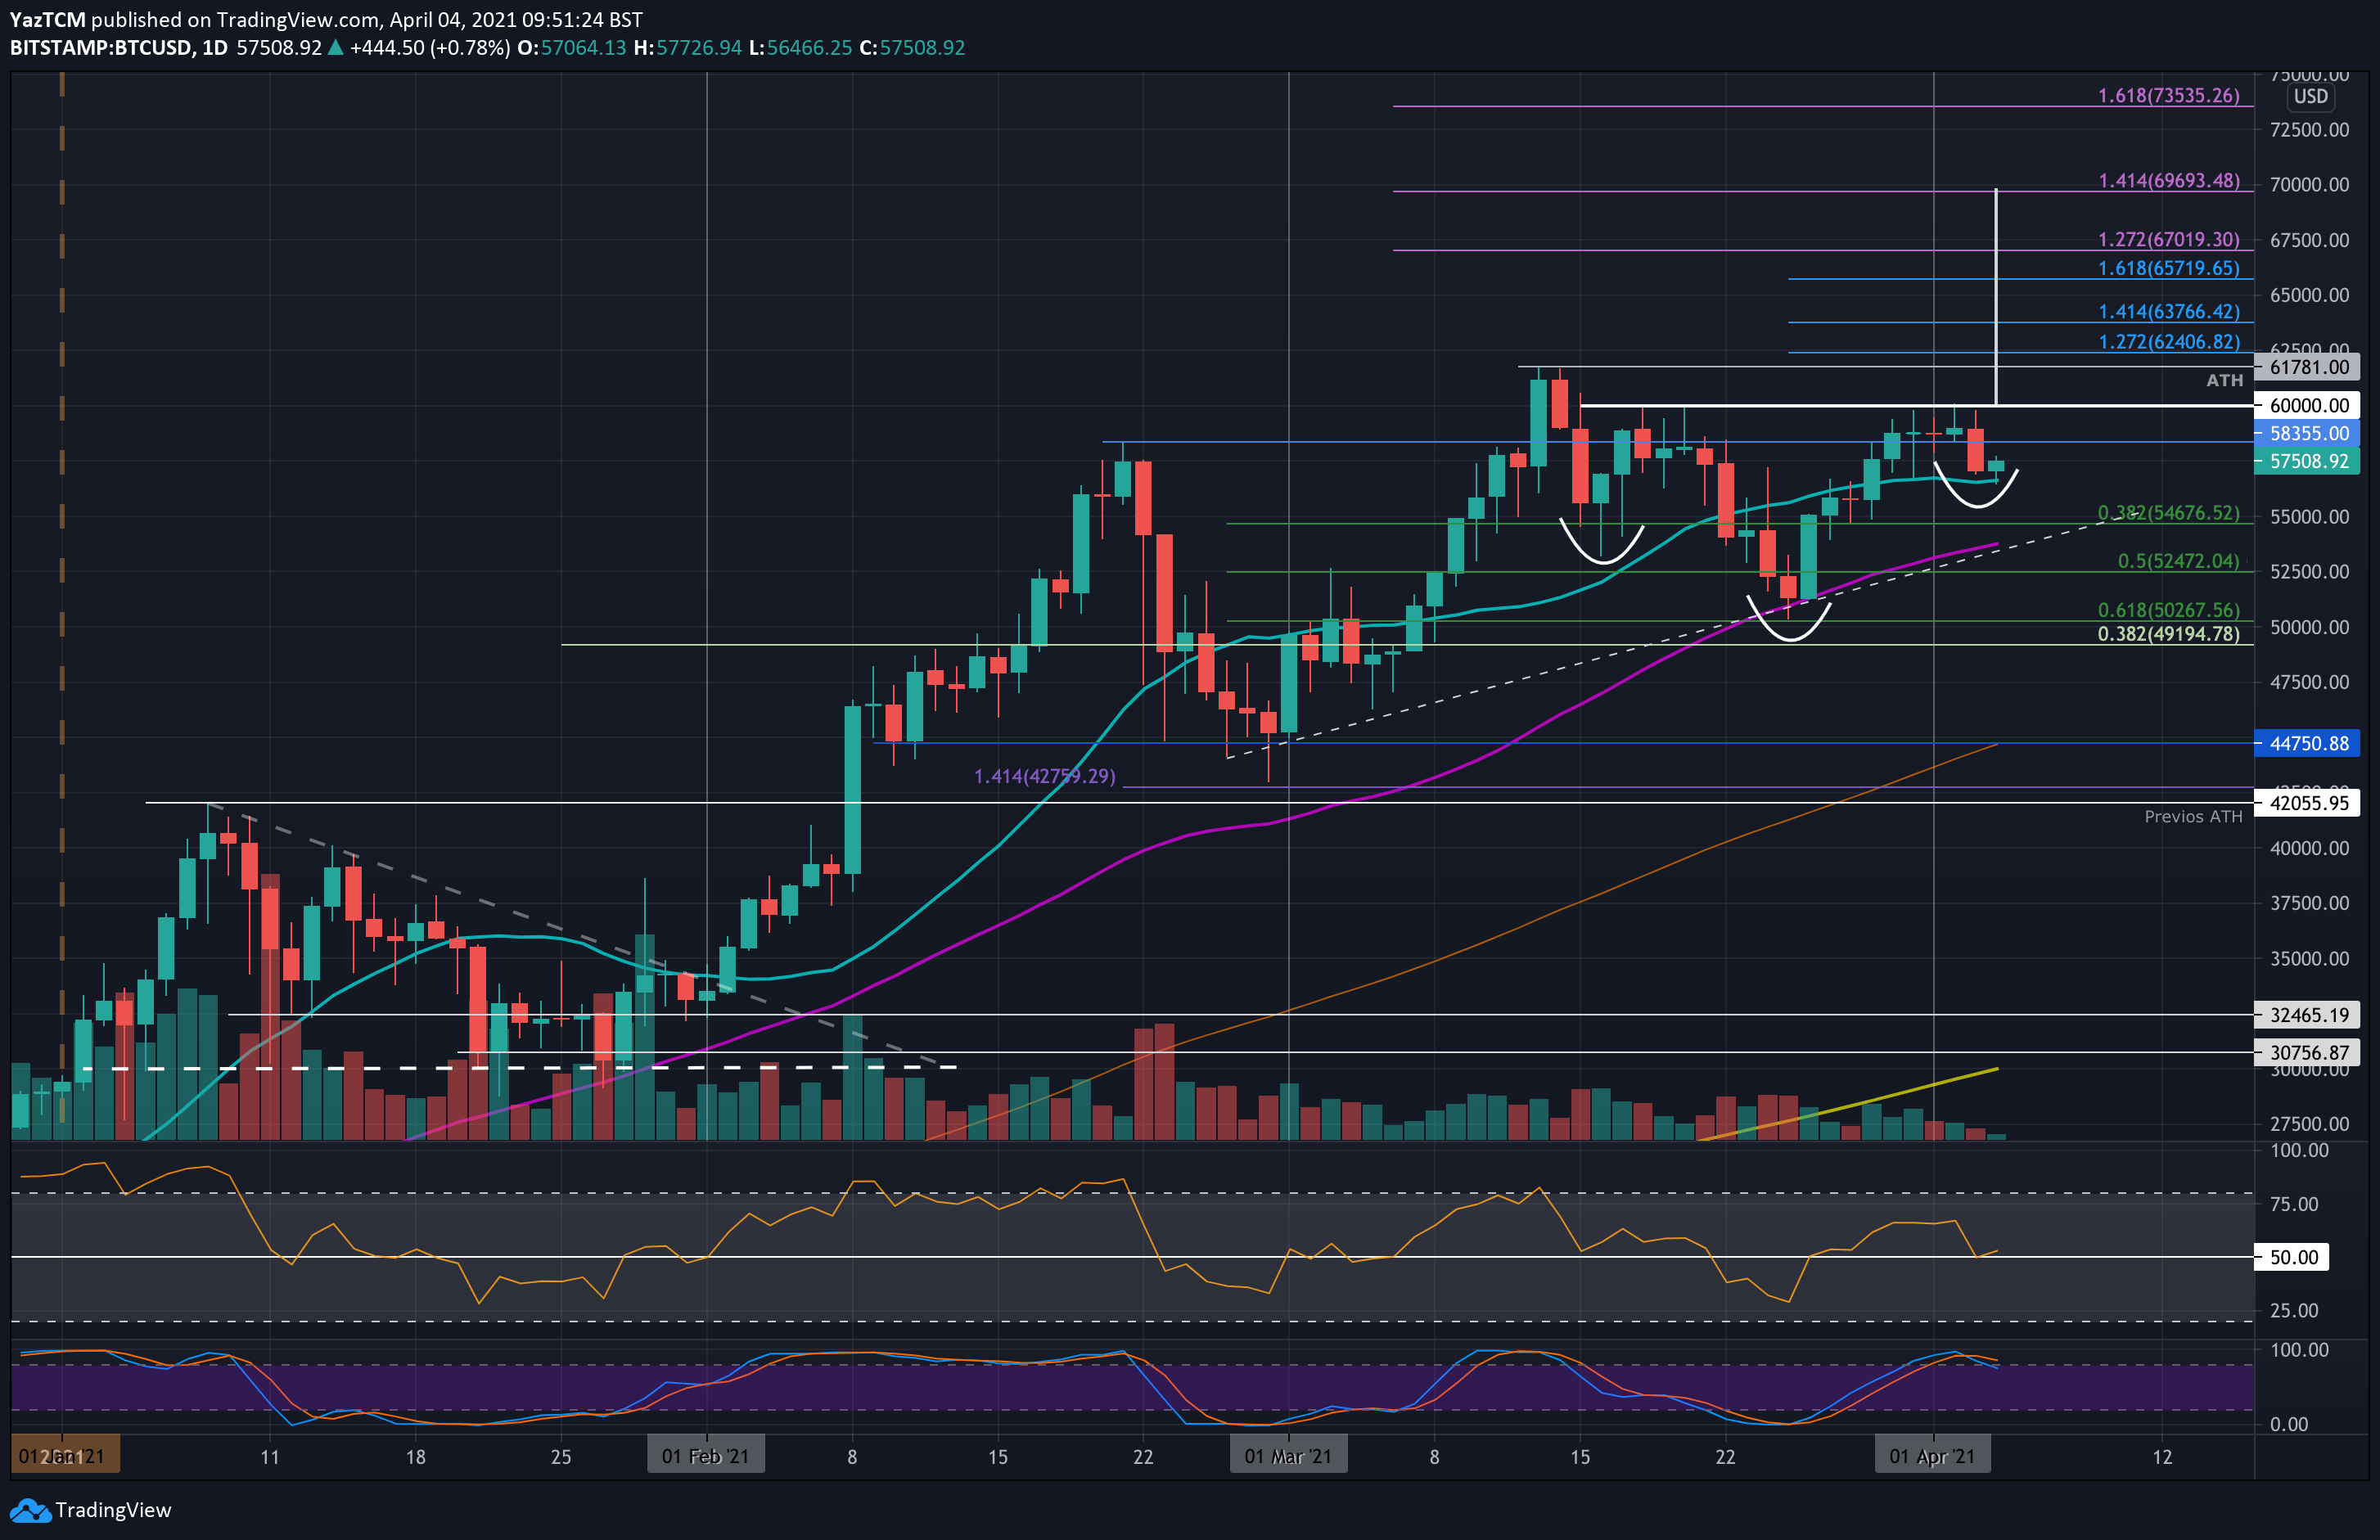
Two scenarios from here: the bullish one will be a fifth attempt to break the $60k line. In case of success, Bitcoin will complete an inverse head and shoulders with a target of $69k (the size of the pole).
On the other hand, Bitcoin will look to maintain the $54-56k range, which is full of demand. In case of a breakdown, the $50k will be at risk once again.
BTC Price Support and Resistance Levels to Watch
Key Support Levels: $56,400, $54,675, $54,000, $52,470, $50,270.
Key Resistance Levels: $58,355, $60,000, $61,780, $62,400, $65,000.
Looking ahead, the the first resistance lies at $58,355. This is followed by the critical level of $60,000. Beyond $60k resistance is expected at $61,780 (ATH price), $62,400 (1.272 Fib Extension), $65,000, and $67,000 (1.272 Fib Extension – purple).
On the other side, the first support lies at $56,400 (20-day MA and today’s low), $54,675 (.382 Fib), $54,000 (rising trend line & 50-day MA), $52,470 (.5 Fib), and $50,270 (.618 FiB).
The daily RSI dropped from bullish momentum to the midline to indicate indecision within the market. If it continues beneath 50, the bearish momentum is likely to drive BTC beneath $56,400.
Bitstamp BTC/USD Daily Chart
Bitstamp BTC/USD 4-Hour Chart