Bitcoin Price Analysis: Is BTC Back Bullish After Touching Long-Term Support From March 2020?
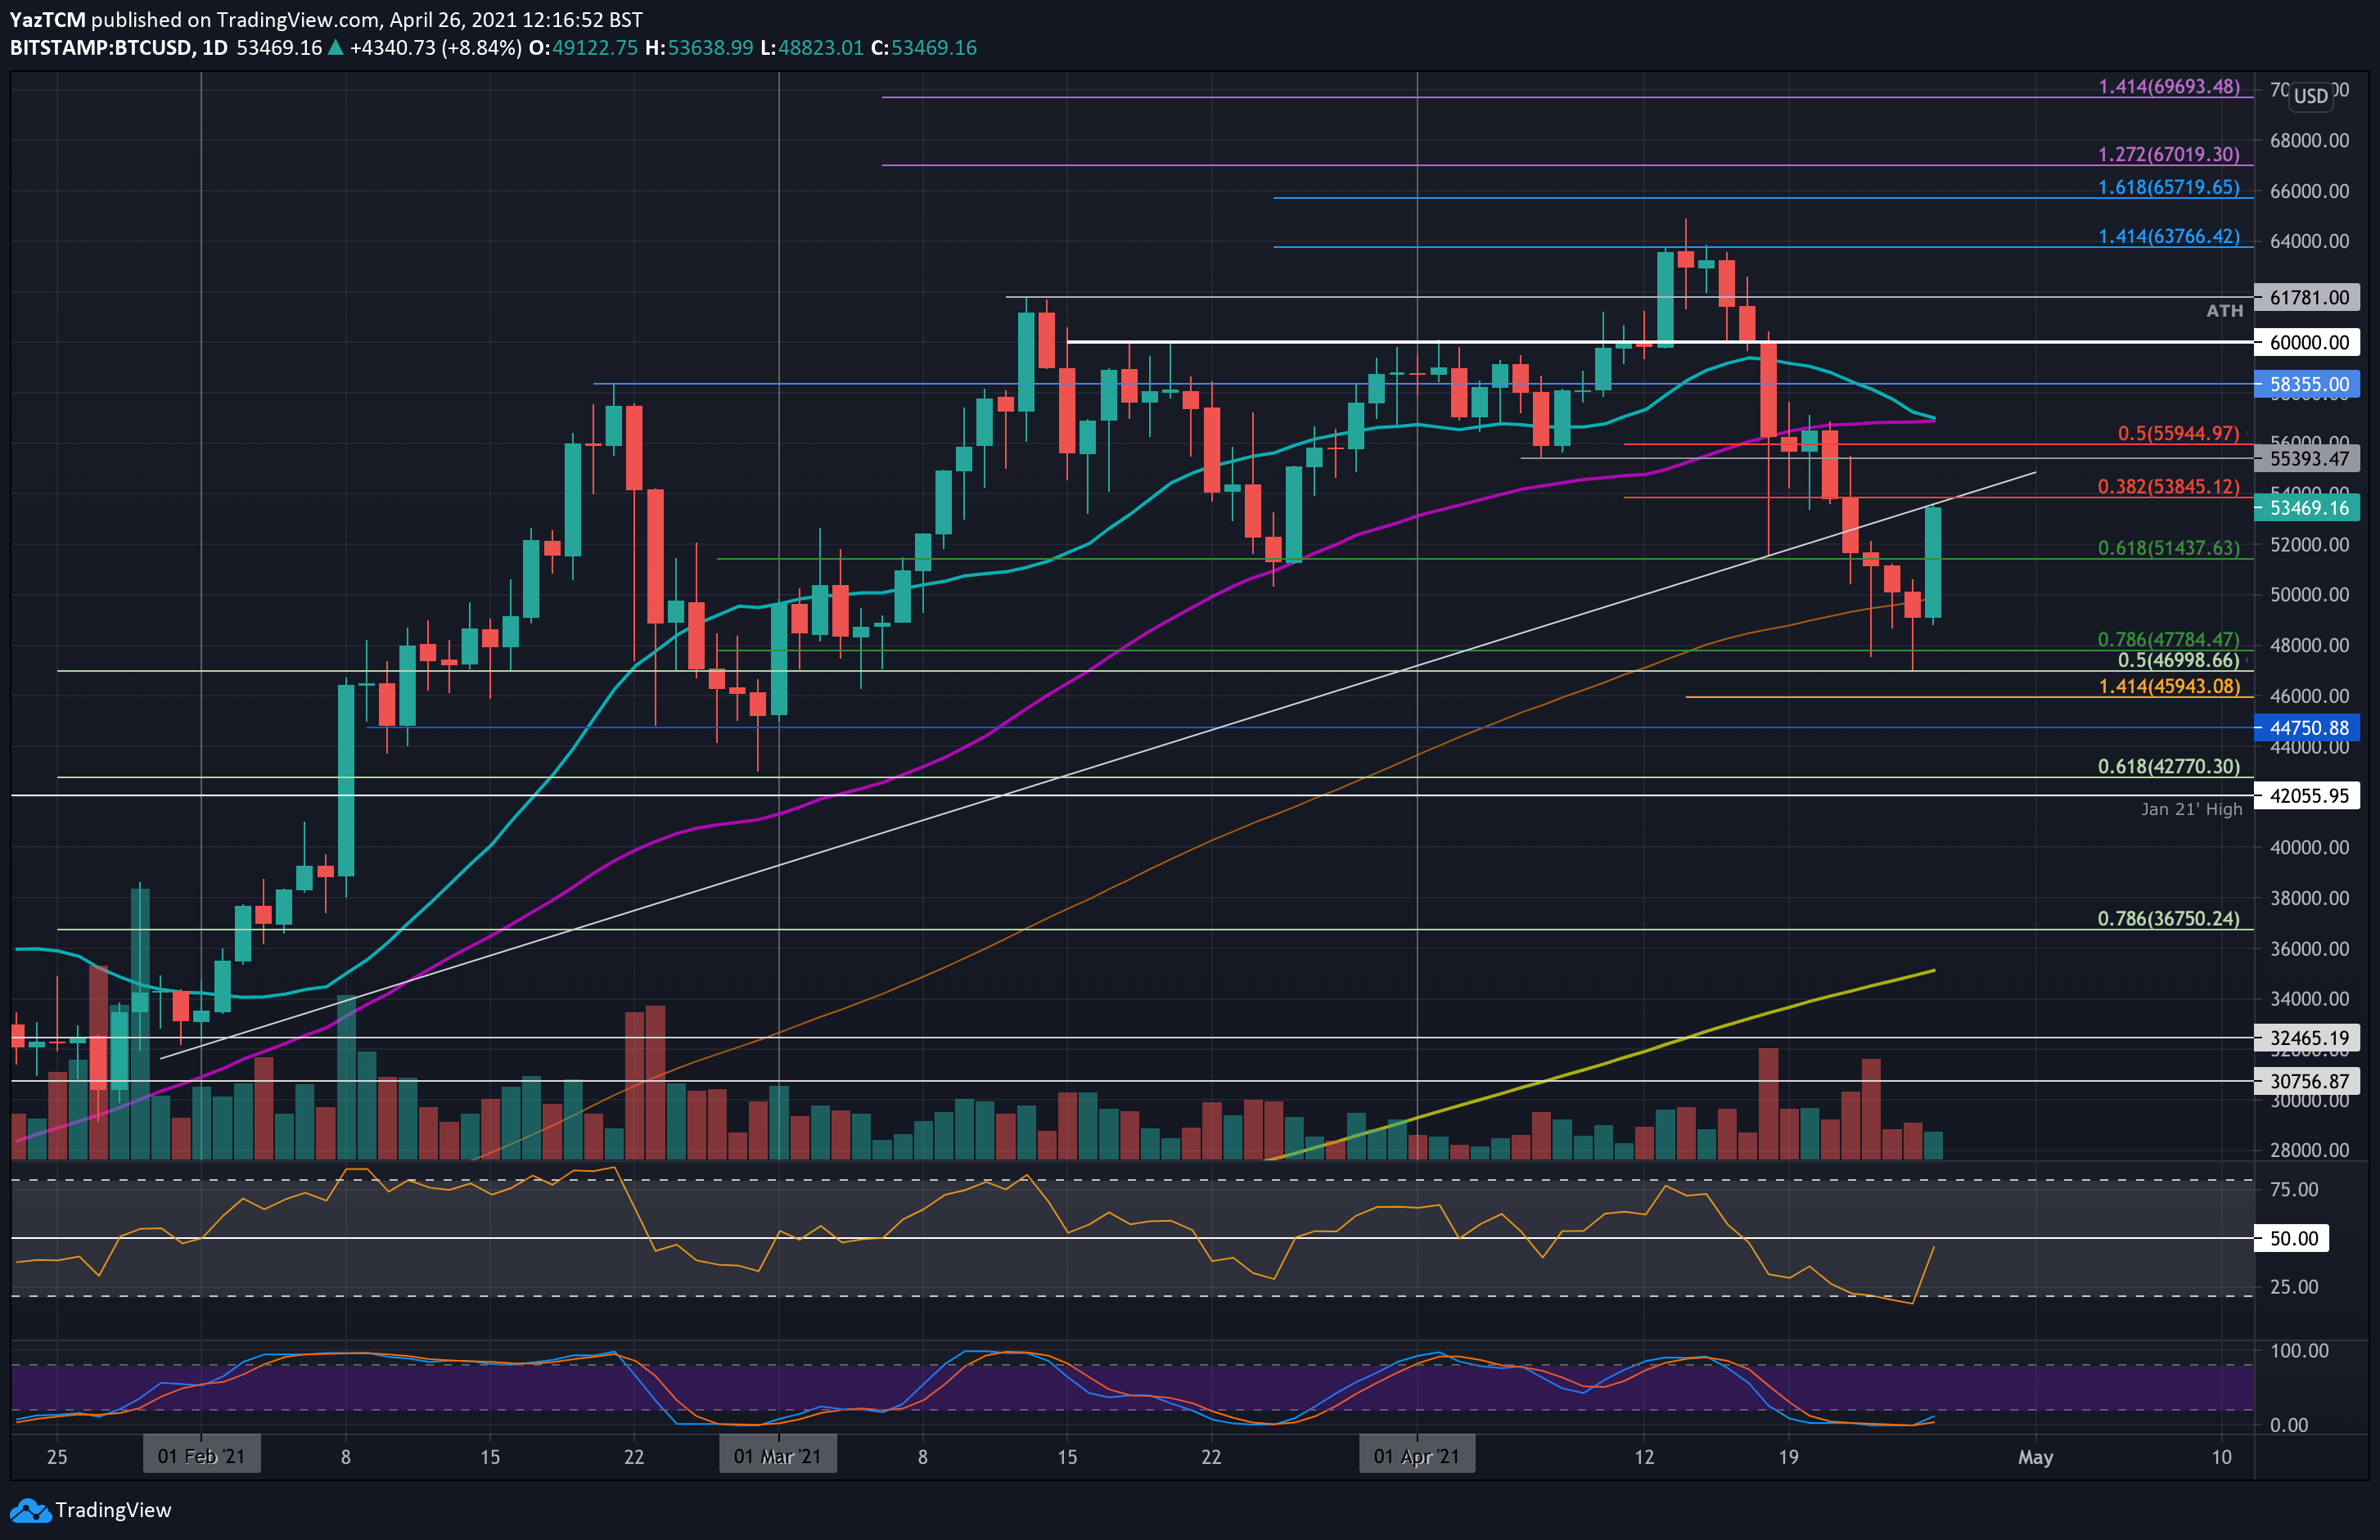
Bitcoin price starts this new week with a strong 8% rebound, as it soars back above the $50k mark. The primary cryptocurrency dropped from $60,000 last Sunday, and it collapsed beneath the 50-days MA level through the week. It continued to decline beneath $50,000 to reach as low as $47,000 (.5 Fib) yesterday, shortly before the quick bullish bounce.
The large wick, as can be seen on yesterday’s daily candle, is a very strong signal that the bull run might still be alive, whereas there is a heavy demand to buy Bitcoin below $50,000. Additionally, the significant level of the 100-day moving average line seemed to hold the recent drop.
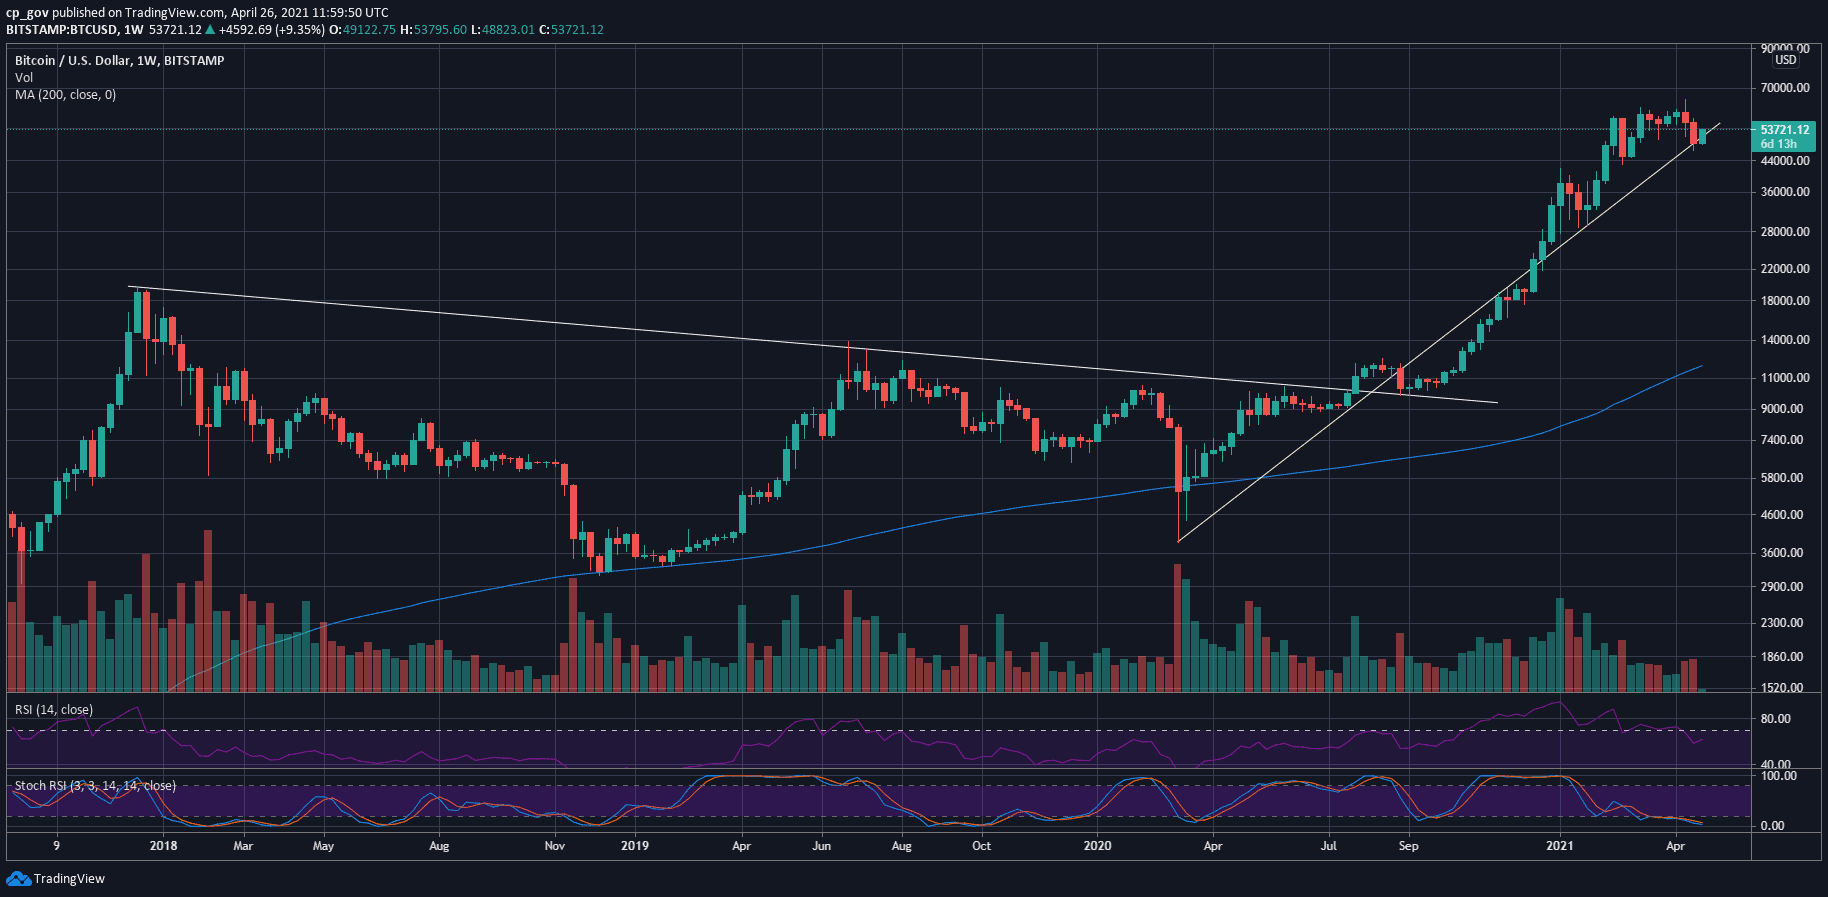
Looking at the longer term – the BTC/USD weekly chart below – we can see that last week’s candle did not close beneath the long-term ascending trend line that dates back to last year’s COVID19 March 2020 market crash. So far, this week’s new candle looks promising for the bulls. However, things in crypto can change quickly.
BTC Price Support and Resistance Levels to Watch
Key Support Levels: $53,100, $51,440, $50,000, $59,910, $47,000, $45,950.
Key Resistance Levels: $53,845, $50,000, $49,910, $47,000, $45,950.
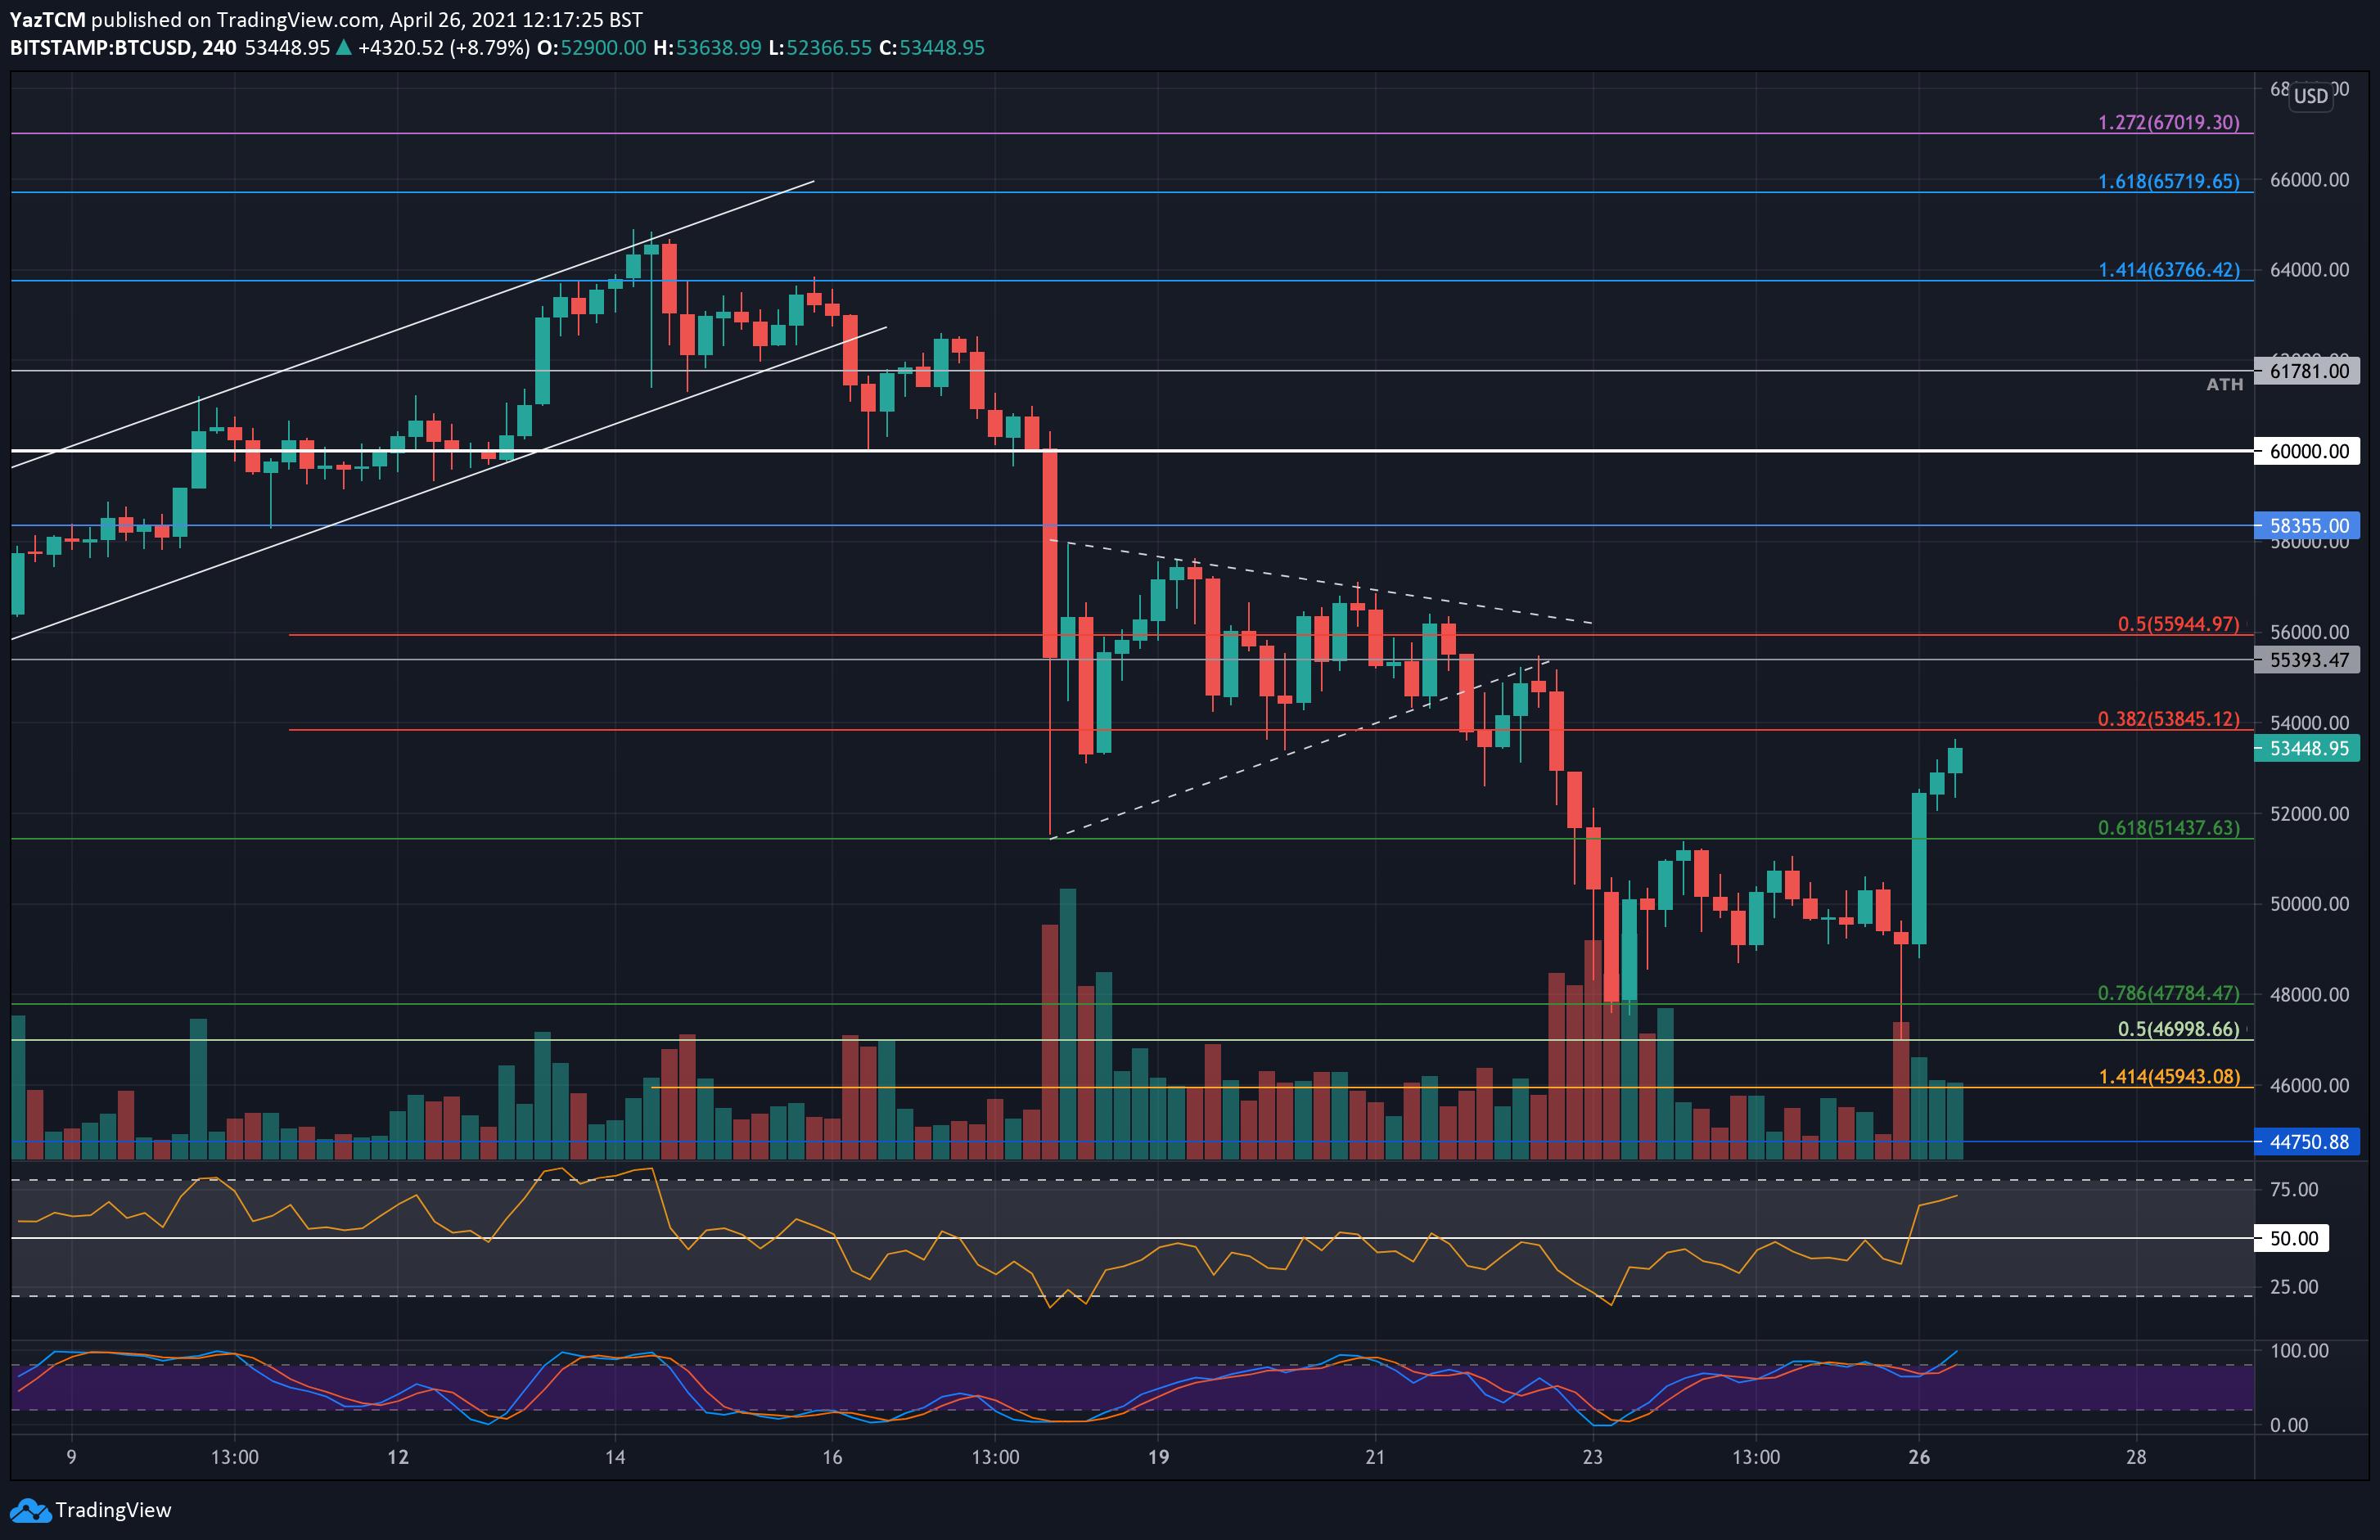
Looking ahead, the first level of resistance lies at $53,845 (bearish .382 Fib). This is followed by $55,960 (bearish .5 Fib), and very critical resistance around $57,000 (20-day & 50-day MAs). Further above lies the February previous ATH of $58,355 and $60,000.
On the other side, the first support lies around the $53k mark (4-hour’s MA-50), followed by $51,440 (.618 Fib), and $50,000, $49,910 (100-days MA). Further below lies $47,000 (.5 Fib & last week’s low), and $45,950 (downside 1.414 Fib Extension).
The daily RSI has bounced higher from extremely oversold conditions. Over the weekend, the RSI was the most oversold since March 2020 – as it was during the first wave of the Coronavirus pandemic. Following today’s bounce, the RSI is now heading back to the midline as the previous bearish momentum ceases.
Bitstamp BTC/USD Daily Chart
Bitstamp BTC/USD 4-Hour Chart