
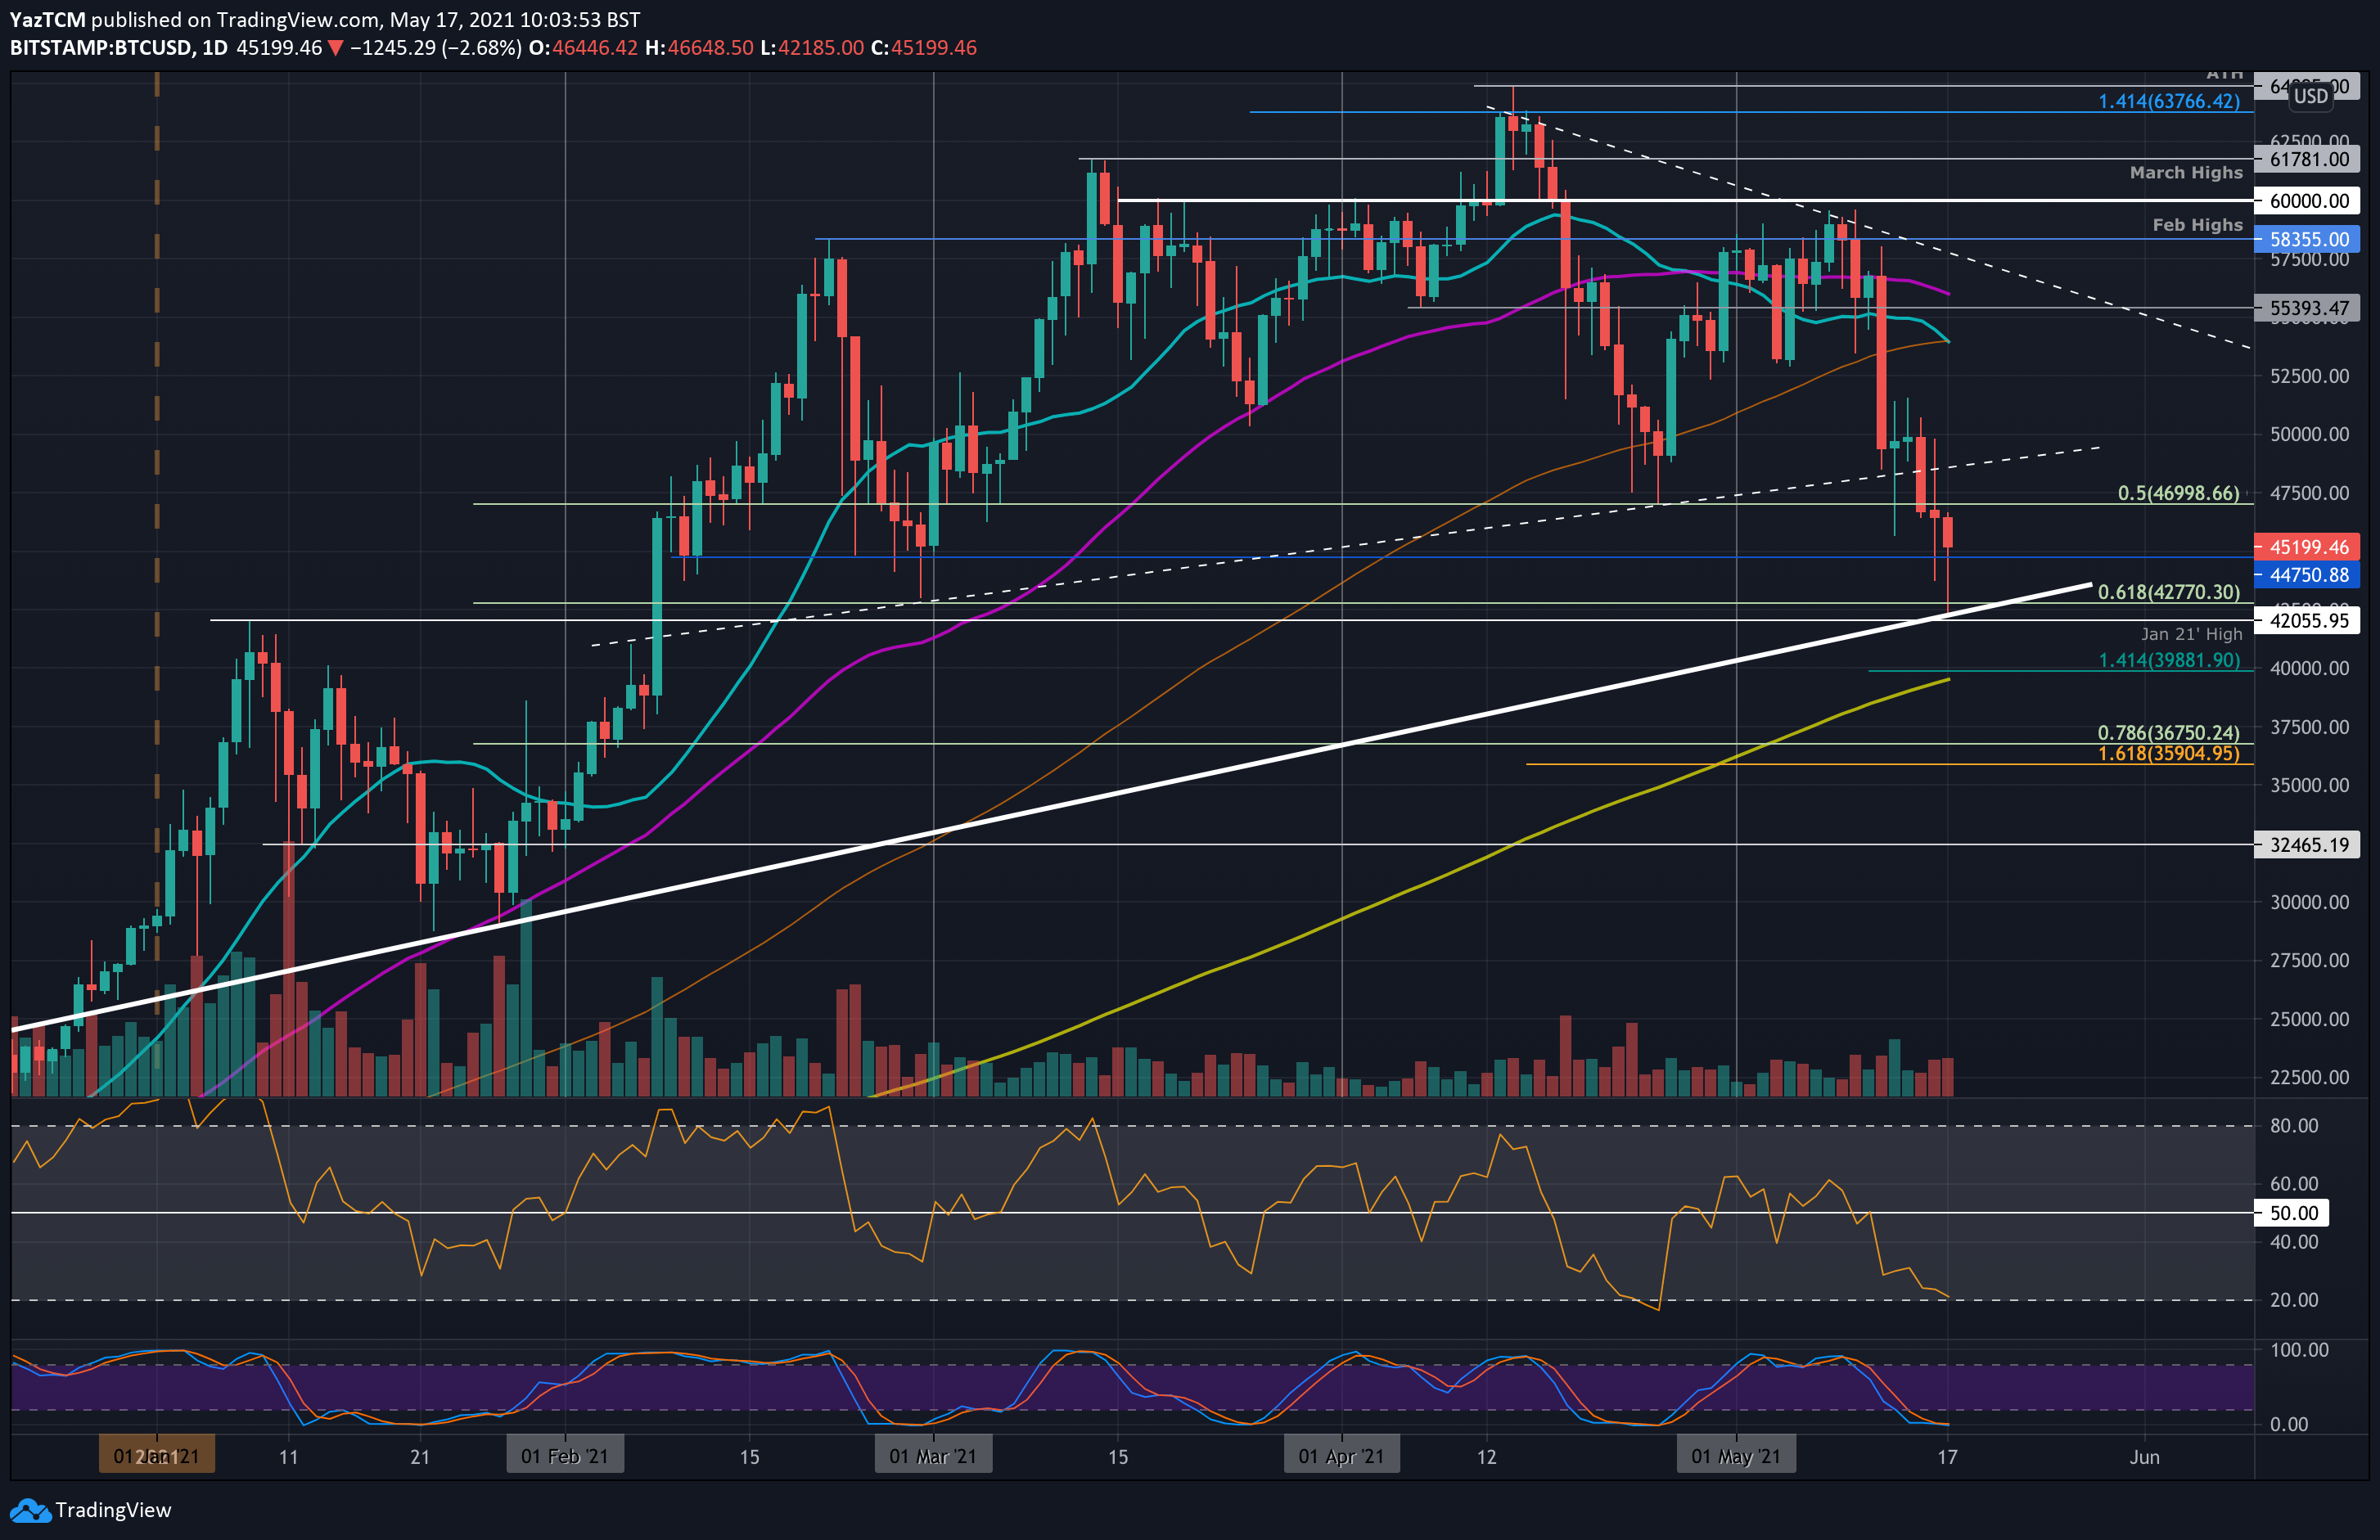
Bitcoin Price Analysis: Is The Current 20% Weekly Drop a Healthy Correction or Sub-40K Coming?
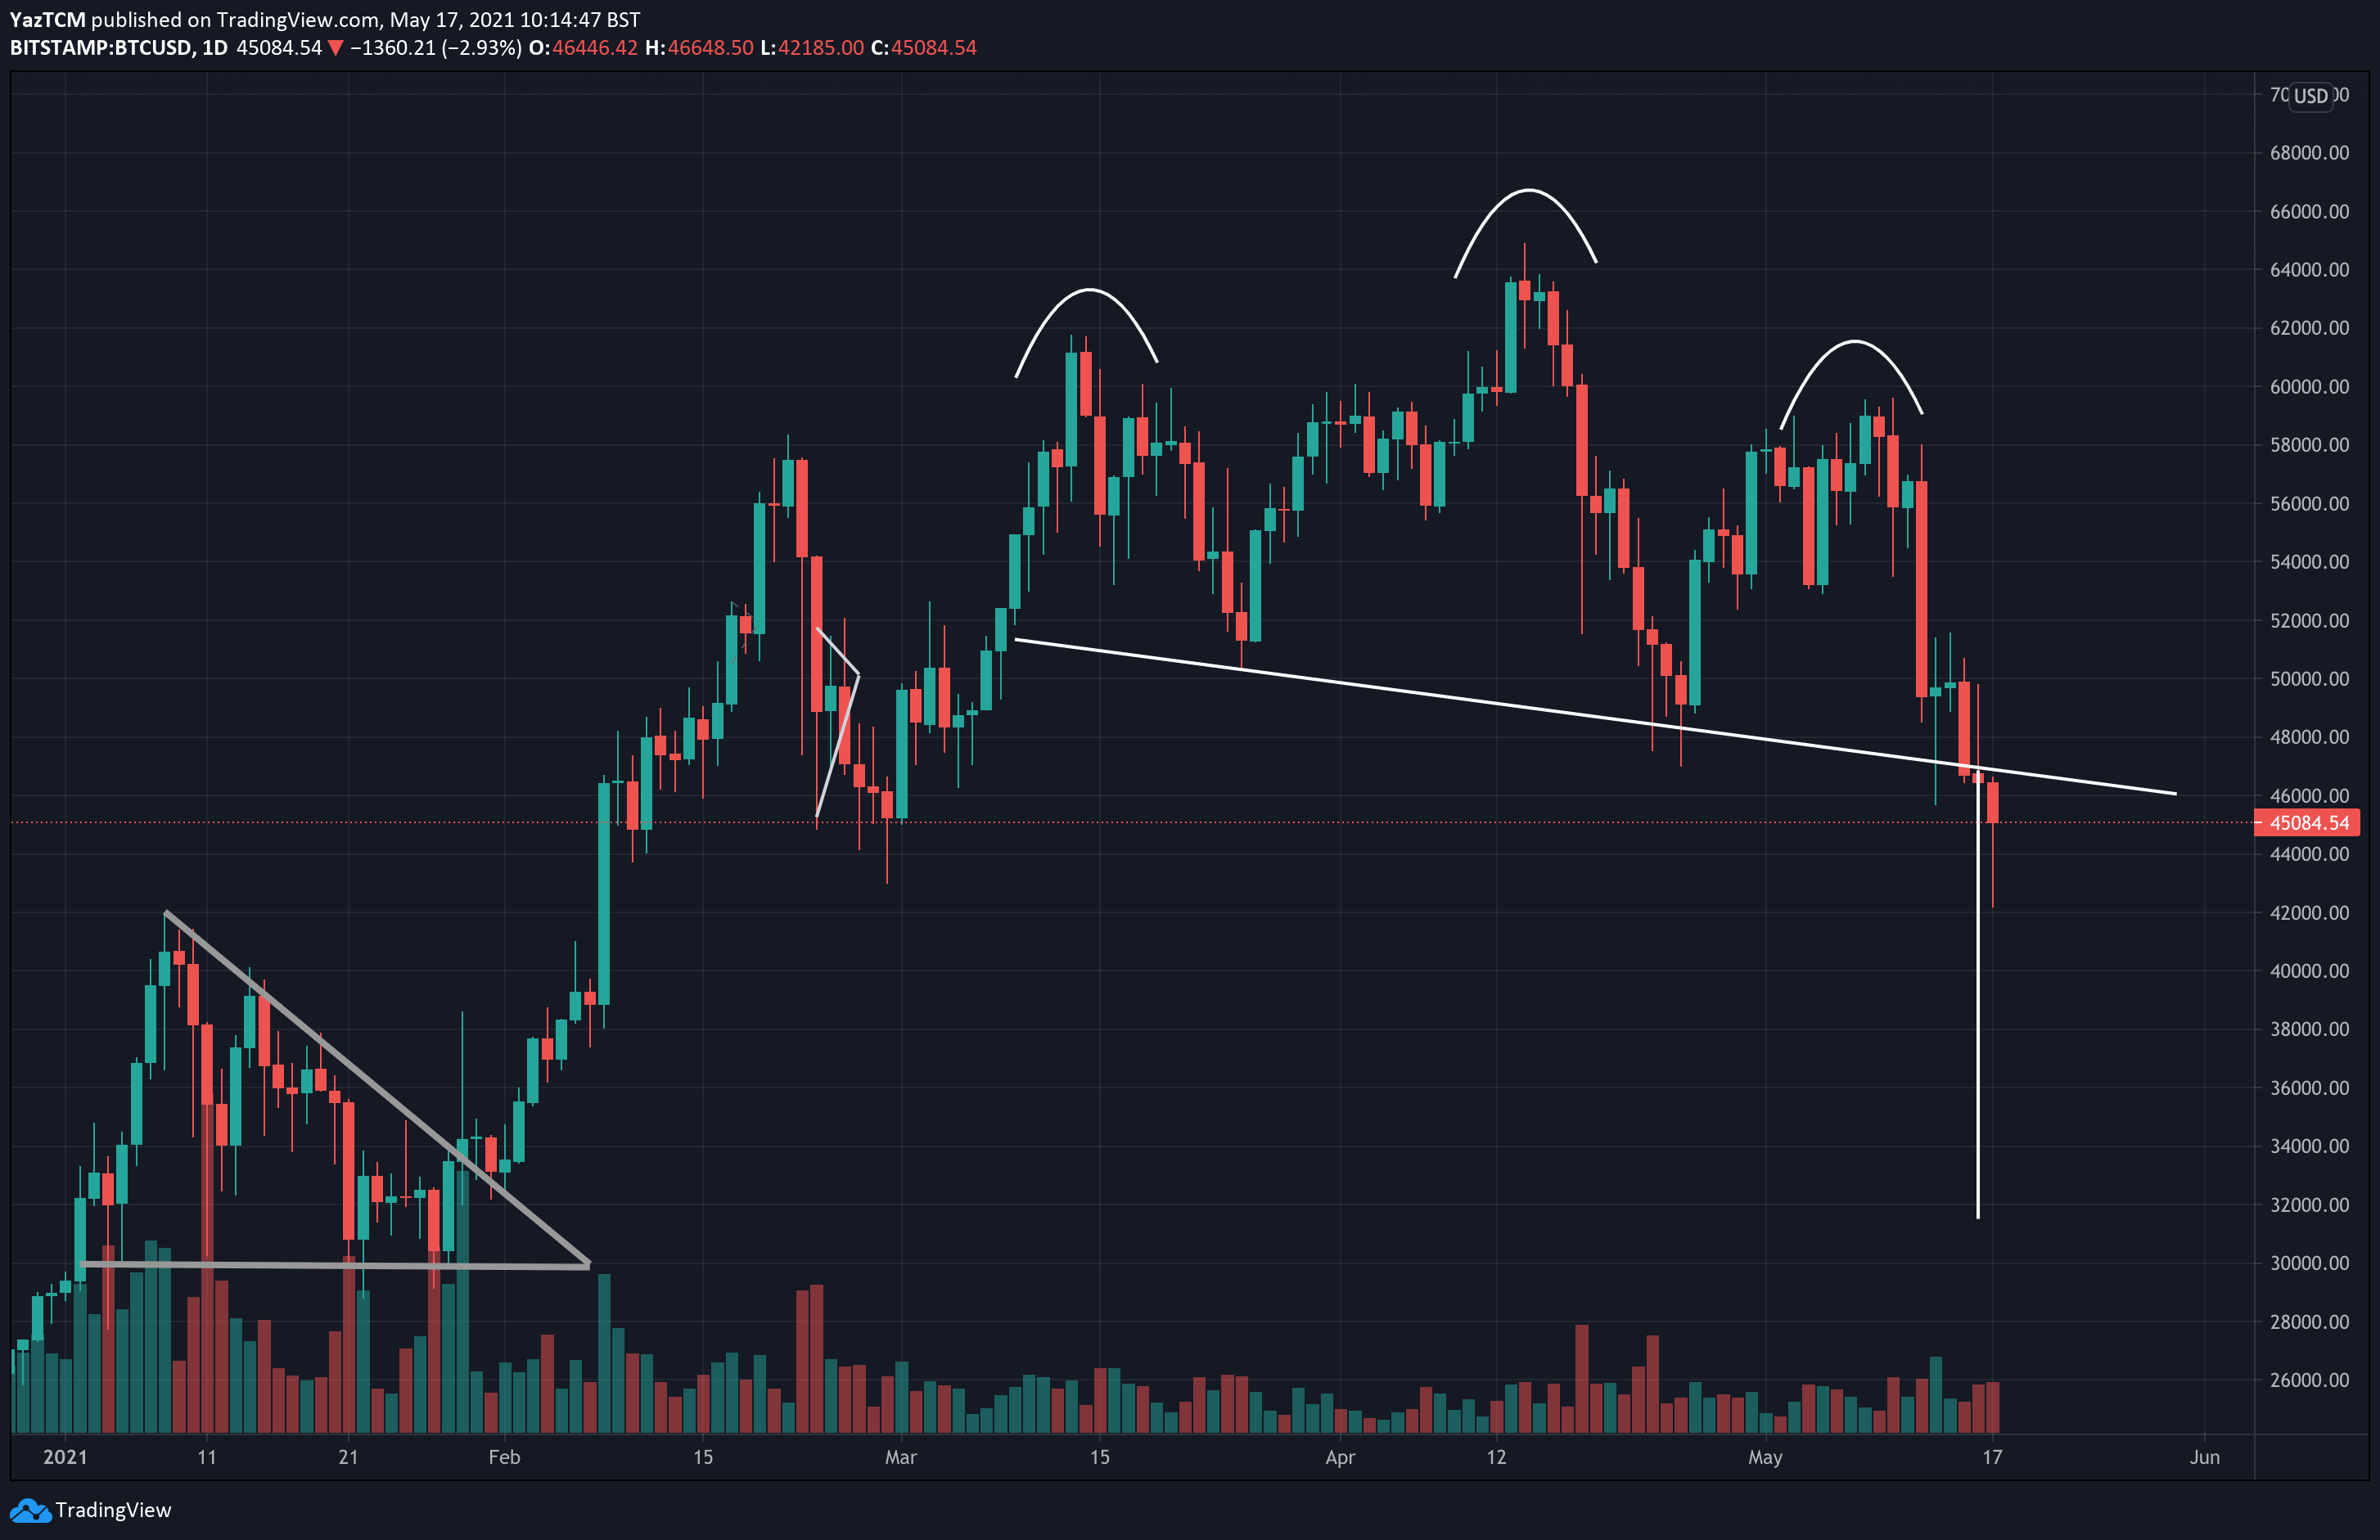
Bitcoin is down another 7.5% today as the cryptocurrency slides into the $45,000 region. The total weekly price decrease now exceeded 20%. The good news? Bitcoin was able to recover after hitting as low as $42K earlier today.
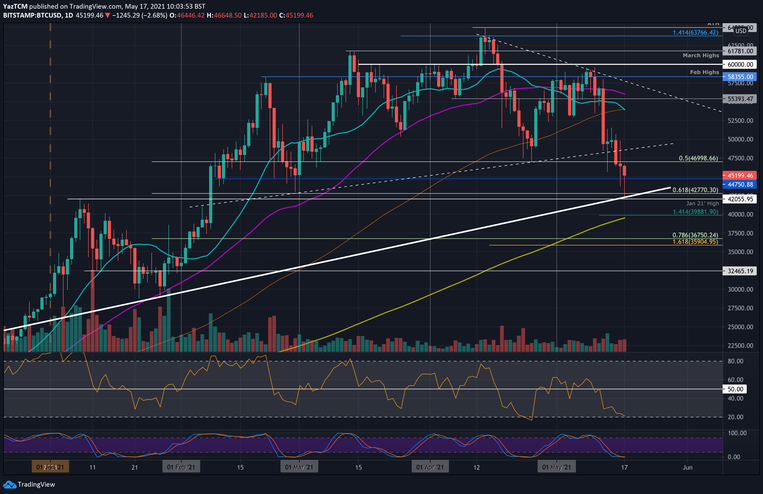
An overview of May: Last week, bitcoin fell beneath a rising wedge formation after Tesla revealed they had stopped receiving BTC payments for their cars. The news caused a significant sell-off in which BTC dropped as low as $47,000, where it found support at a .5 Fib.
During this sell-off, BTC managed to close each daily candle above a rising trend (dashed line) dated back to February 2021.
However, this support was broken over the weekend after BTC closed at $47,000. It continued lower yesterday as it dropped beneath $47,000 to create a fresh three-month low at $42,185, following some more of Elon Musk’s tweets.
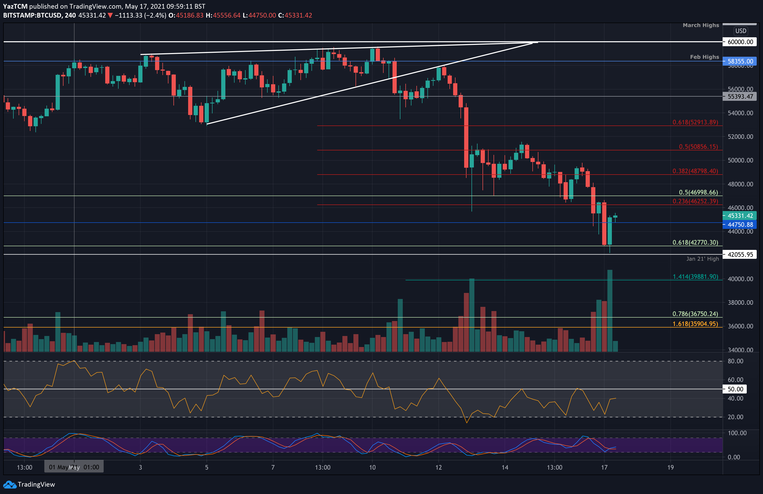
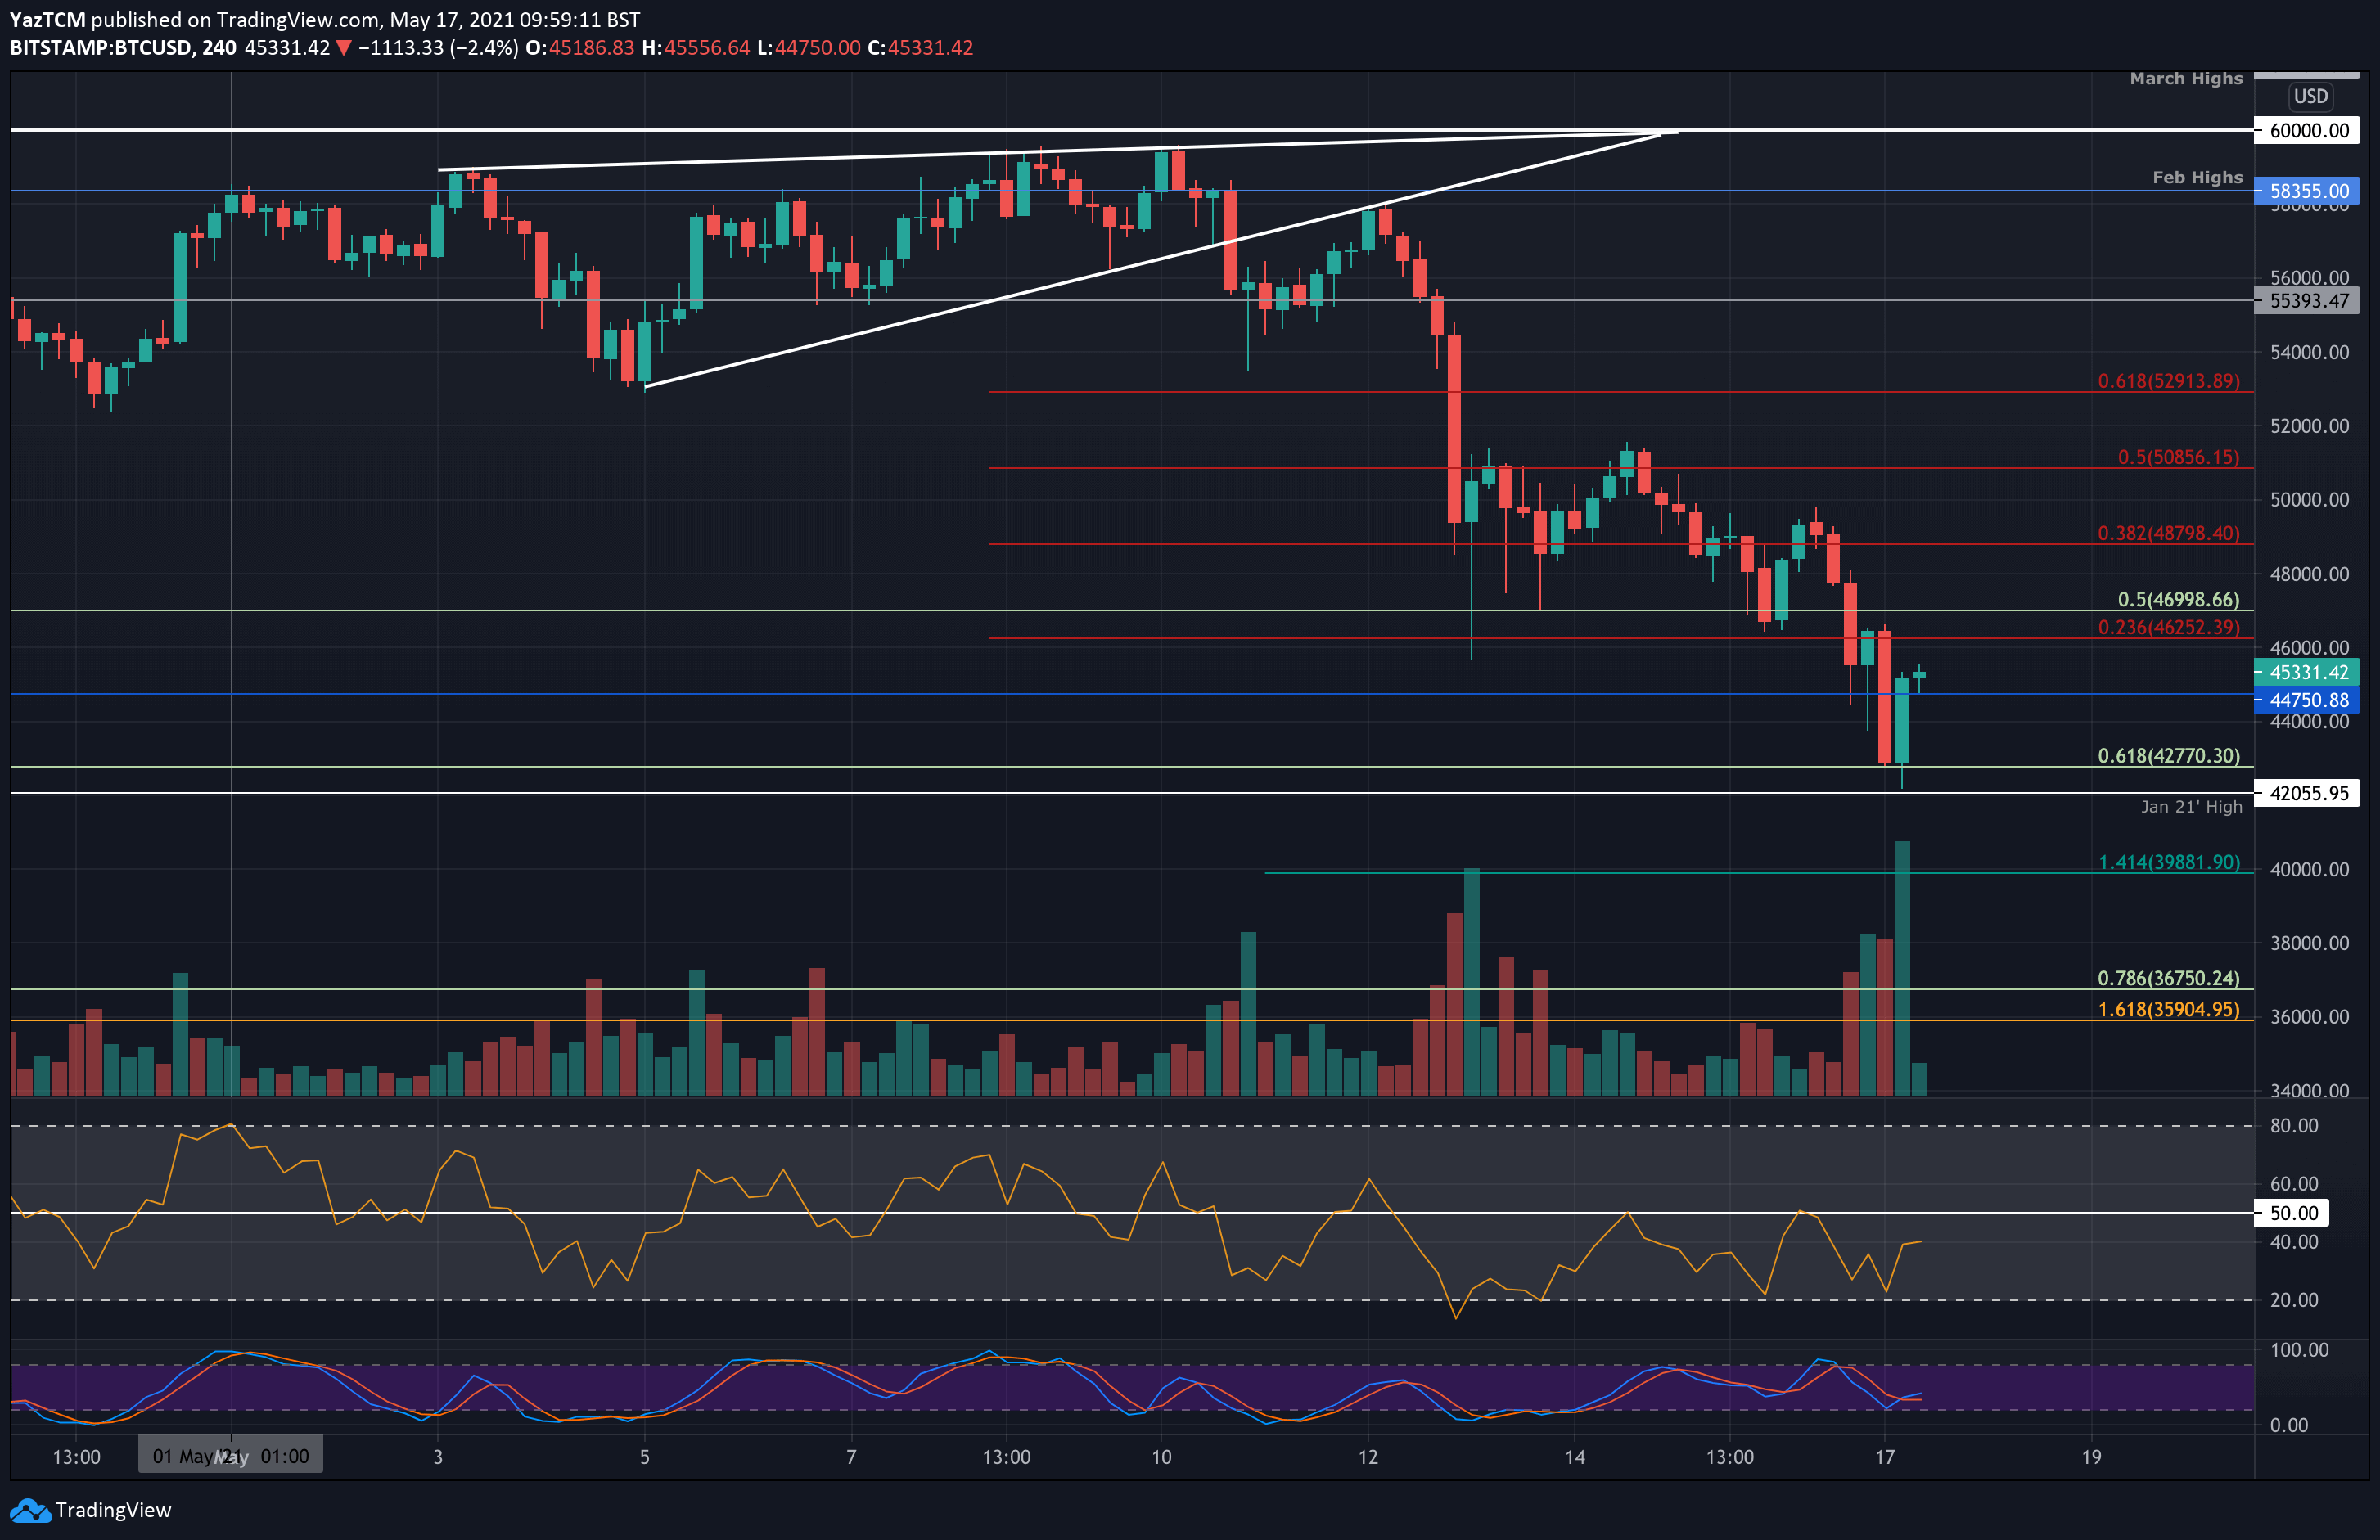
There, BTC found support at a long-term ascending trend line that dates back to December 2020, together with support at $42,770 – provided by the .618 Fib Retracement – best seen on the following 4-hour chart. The market rebounded from there and pushed higher to break back above $45,000, as of writing these lines.
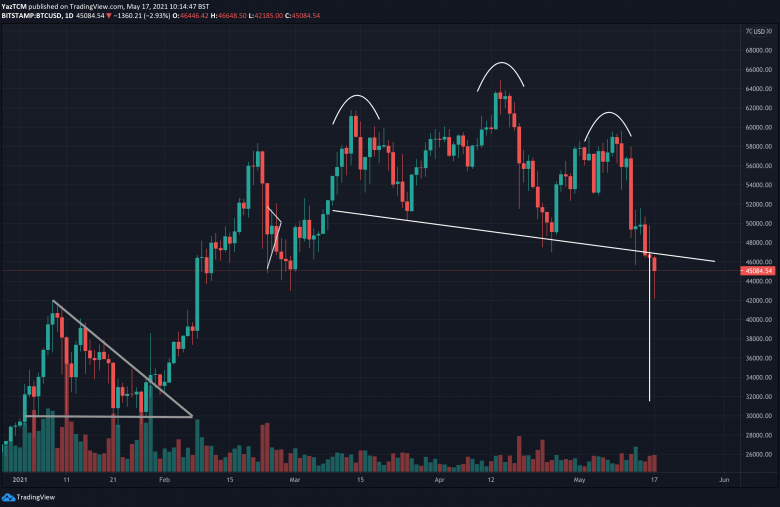
Interestingly, the new three-month low has created a fresh lower low for bitcoin. It also caused the market to break beneath the neckline of a long-term head & shoulders pattern we have been tracking over the past week. The break of this pattern could see BTC heading as low as $32,000 in case the pattern plays out. Unless bitcoin maintains the neckline around $47-48k – the risk is on.
After all, we do have to remember that the market is still bullish on the longer timeframe charts, and 20-30% corrections are typical during bull runs. In the cycle of 2017, bitcoin price saw six heavy 20-30% corrections.
BTC/USD Daily Chart. Source: TradingView
BTC Price Support and Resistance Levels to Watch
Key Support Levels: $44,750, $44,000, $42,770, $42,000, $40,000.
Key Resistance Levels: $46,250, $47,000, $48,000, $50,000, $50,850.
Looking ahead, the first support now lies at $44,750. This is followed by $44,000, $42,770 (.618 Fib), and $42,000 (Jan 21 Highs along with today’s low). Beneath $42,000, added support lies at $40,000 (downside 1.414 Fib Extension & the 200-day moving average line).
On the other side, the first major resistance is expected at $46,250 (bearish .236 Fib). This is followed by $47,000 (April lows), $48,800 (bearish .382 Fib), $50,000, and $50,850 (bearish .5 Fib).
The RSI is heading lower and nearing highly oversold conditions. This suggests that the bears might already be overextended and could mean that the market should not continue too much lower from here.
Bitstamp BTC/USD Daily Chart
BTC/USD Daily Chart. Source: TradingView
Bitstamp BTC/USD 4-Hour Chart
BTC/USD 4-Hour Chart. Source: TradingViewBTC Analysis, BTCEUR, BTCGBP, BTCUSD, BTCUSDT, Crypto News, Bitcoin (BTC) PriceCryptoPotato


