
Bitcoin Price Analysis: These Signs Point To an Incoming Huge Move

Amidst another low-volume weekend, there are many signs that the bitcoin price is anticipating a huge move, probably over the next few days or even before.
Looking at the bigger picture, BTC had been trading between $30K and $42K since the May-19 crash, and between $30K and $35K since June-19. Overall, BTC faces a decision point ‘flirting’ with a significant descending trend line that dates back to mid-May, the last time BTC was trading above $50K.
Looking at a more short-term perspective, the price continues to trend beneath the 20-day MA as it battles to break back above $34,000. BTC broke down beneath a short-term ascending trend line on Thursday, but the buyers managed to defend the support level at $32,700 on the daily timeframe. But still, BTC got rejected and still unable to break above the 20-day MA resistance.
The Reasons Why BTC Price Move Is Imminent
The following daily chart contains the Bollinger Bands indicator, which is a technical indicator that can predict major market moves and is now at its tightest level since December 2020.
At the end of 2020, BTC broke $20K to the upside setting a new ATH after 3 years. Following this breakout, BTC gained over 200% in a matter of four months, until setting the current ATH at almost $65K on April-14, 2021.
The tightest the level the Bollinger Bands are, which is the distance between the top and the bottom band, the higher the chance that a strong price move will follow.
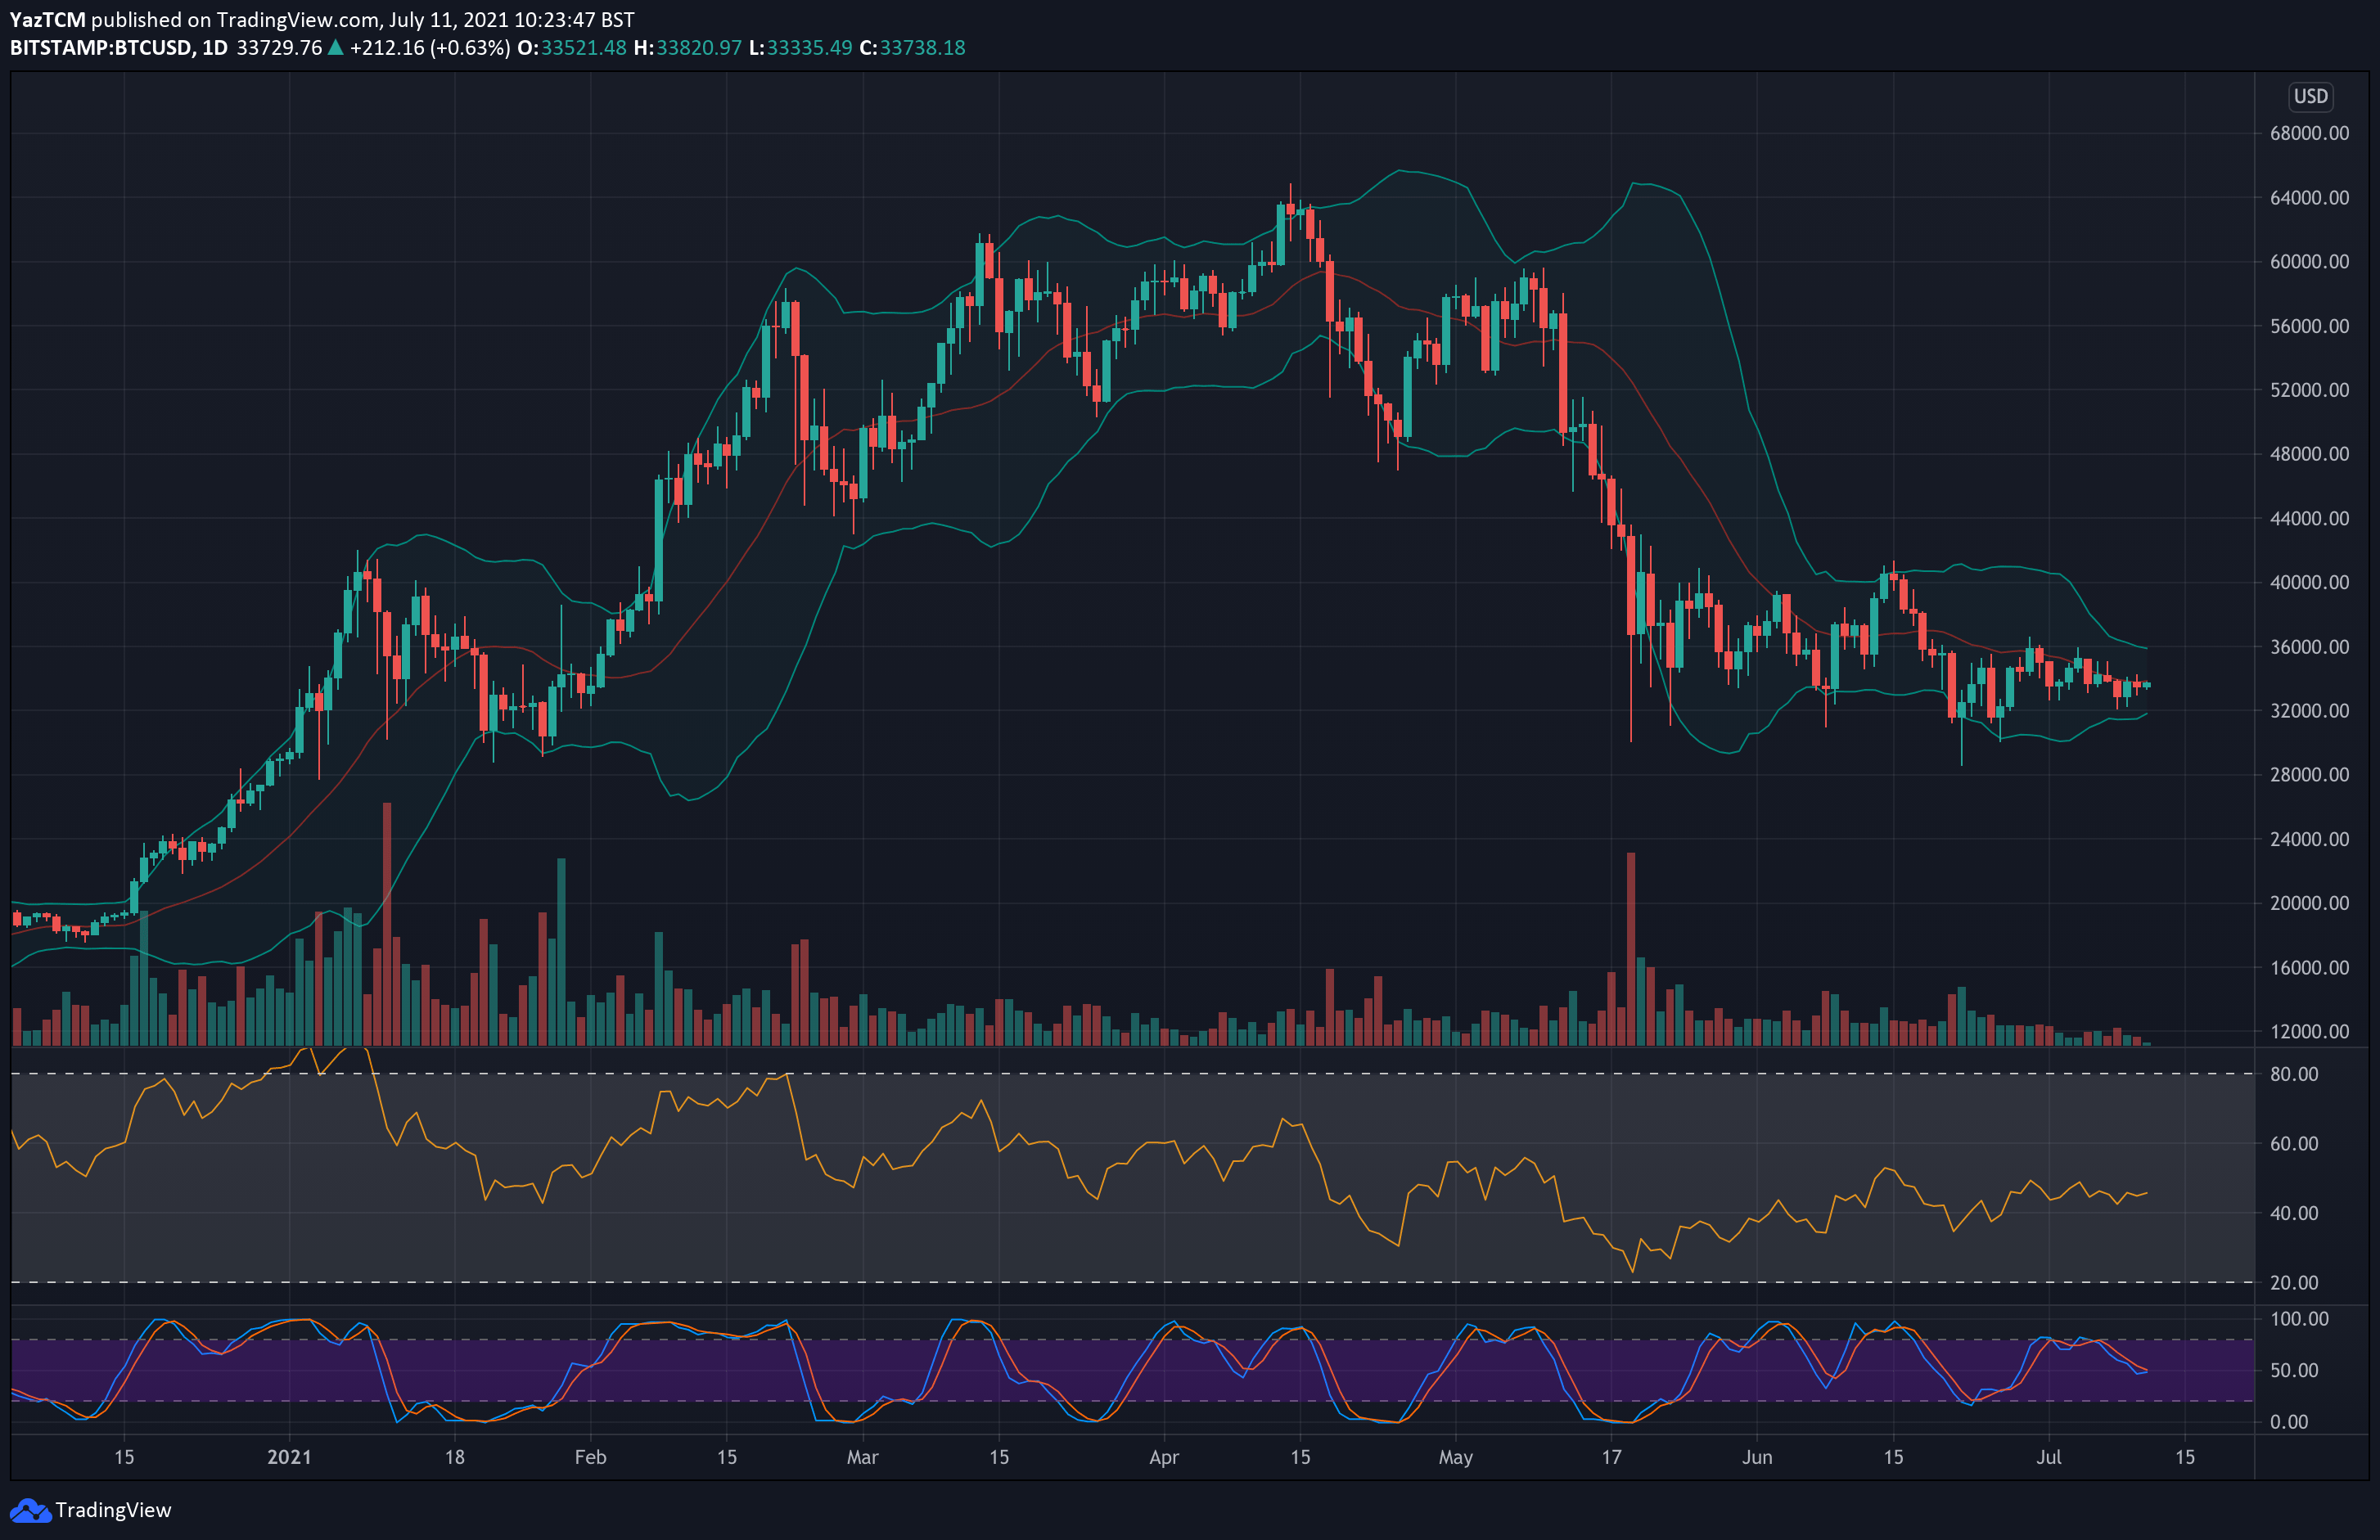
BTC/USD Daily Chart. Source: TradingView.
Another indicator that suggests an incoming considerable move is a decreasing amount of trading volume in July, which includes the two lowest days by trading volume in the whole year 2021 so far. This was recorded last Saturday and Sunday.
Typically, when the volume remains very low, it is then followed by a massive move in either direction. The following volume chart shows the daily volume level. As can be easily seen, May-19 was the highest day, but so far, the first 10 days of July were very low in volume.
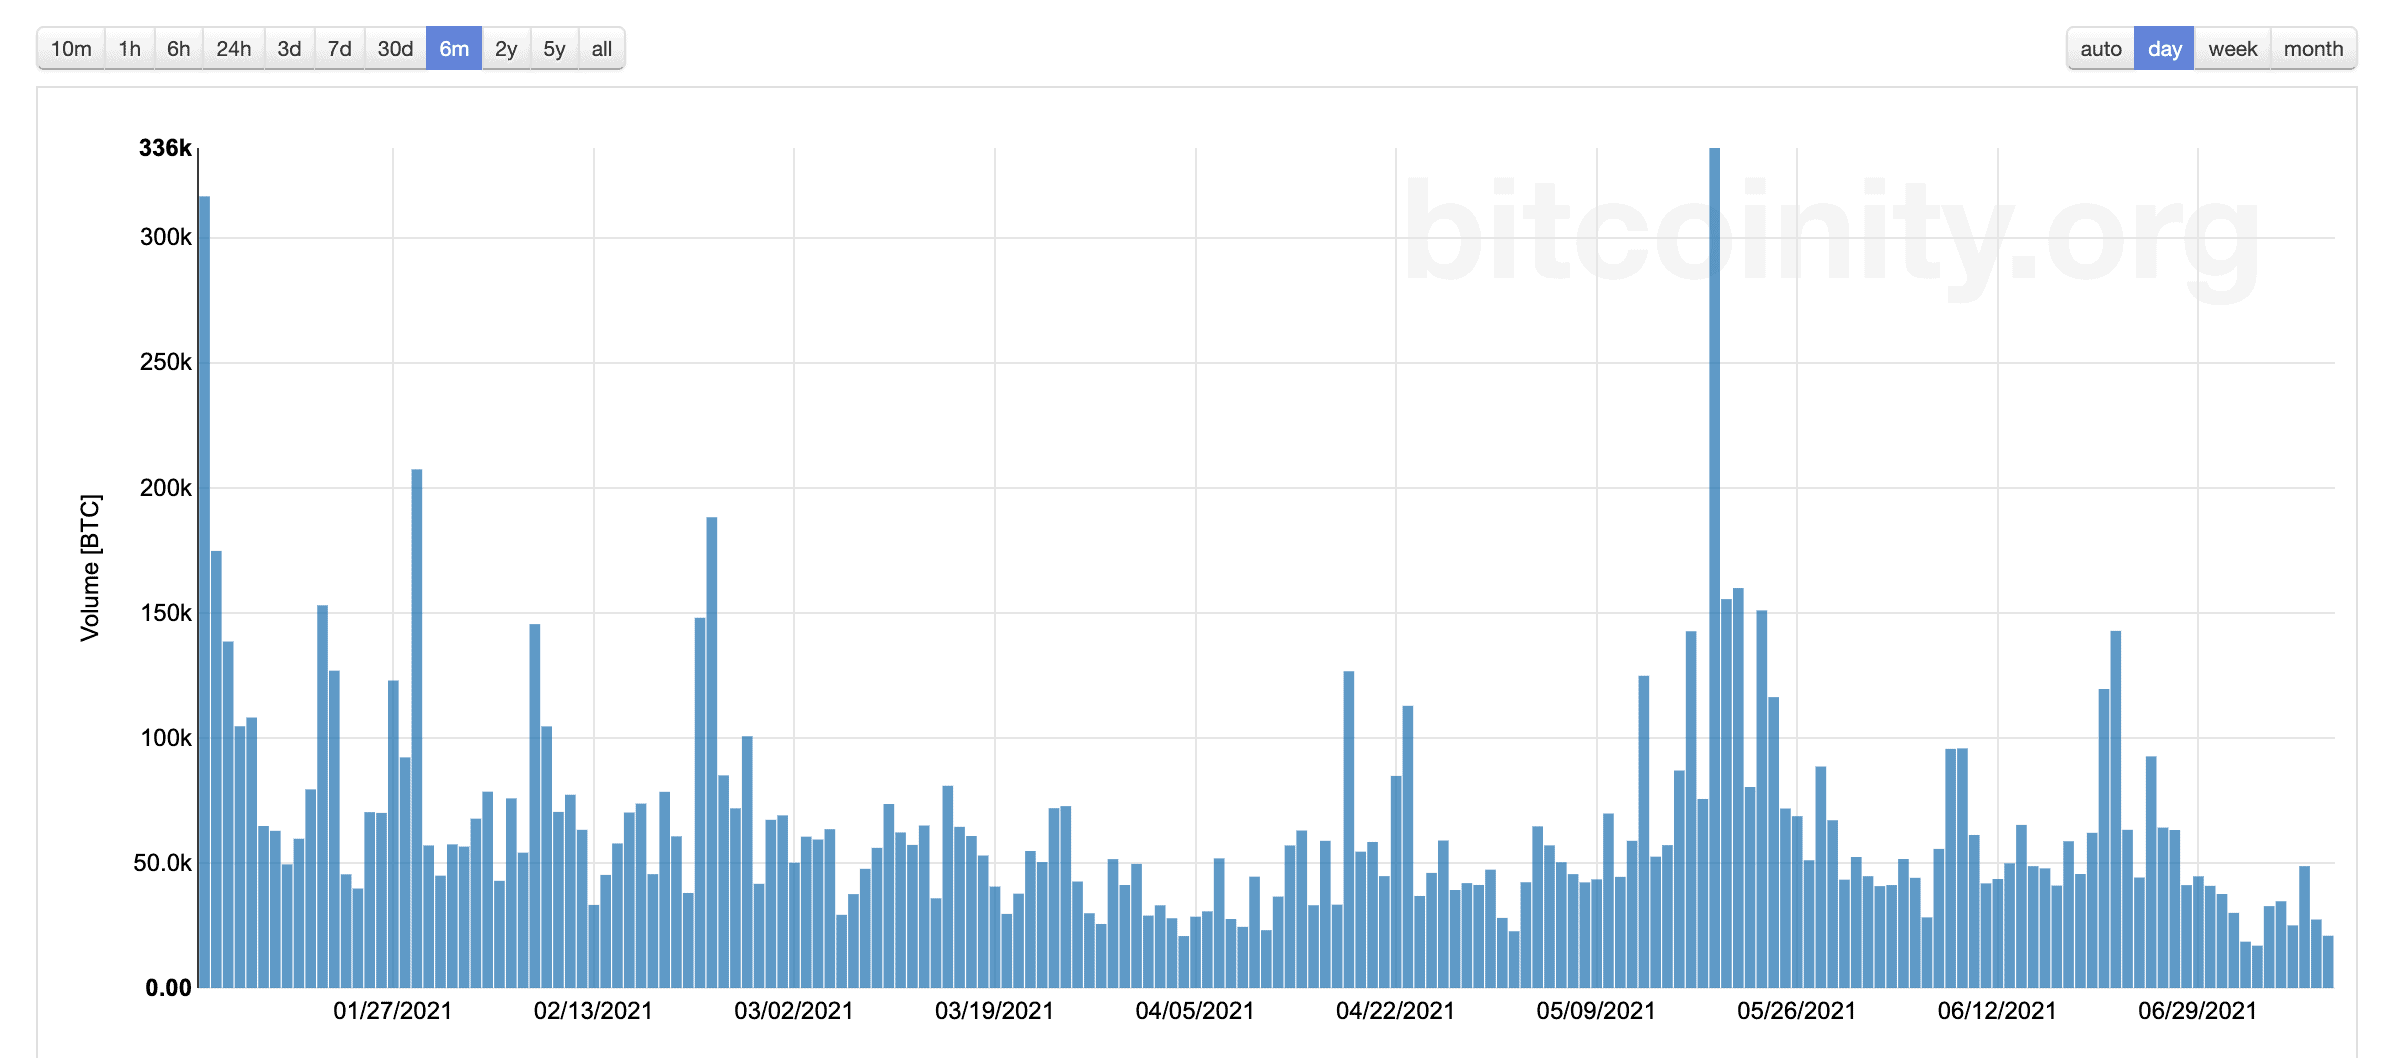
BTC cumulative volume. Source: Bitcoinity
Besides the technicals, there are some fundamentals we can’t ignore: The crypto markets are facing the first-ever GBTC shares unlock, expected to take place during the next week.
Next Saturday, over 16K BTC will be unlocked from the Grayscale Trust Fund, and investors afraid of a potential sell-off to these coins. However, as often happens, the market might react in the opposite direction. In any case, investors are unclear whether the upcoming GBTC unlocking will affect the market and how, and prefer to wait on the sidelines.
In conclusion, the above-mentioned reasons, combined with the fact that BTC is consolidating for almost two months already, might indicate a huge price move incoming over the next few days, or even over the next hours.
BTC Price Support and Resistance Levels to Watch
Key Support Levels: $33,500, $32.7K, $31,500 – $31,185, $30,600, $30K.
Key Resistance Levels: $34,000, $35,600, $36,620, $38,500, $39,500.
Looking ahead, the first major resistance lies around $34K, provided by the 20-day MA and the long-term descending trend line. This is followed by $35,600 (50-day MA), $36,620 (late-June high), $38,500 (1.272 Fib Extension), and $39,500 (early-June high).
On the other side, the first support lies at $33,500. This is followed by $32.7K, $31,500 (double bottom support on the daily), $31,185 (downside 1.618 Fib Extension), $30,600, and $30,000.
The daily RSI remains beneath the midline and still unable to overcome the long-term descending trend-line, preventing a higher high on the RSI since late February.
Bitstamp BTC/USD Daily Chart
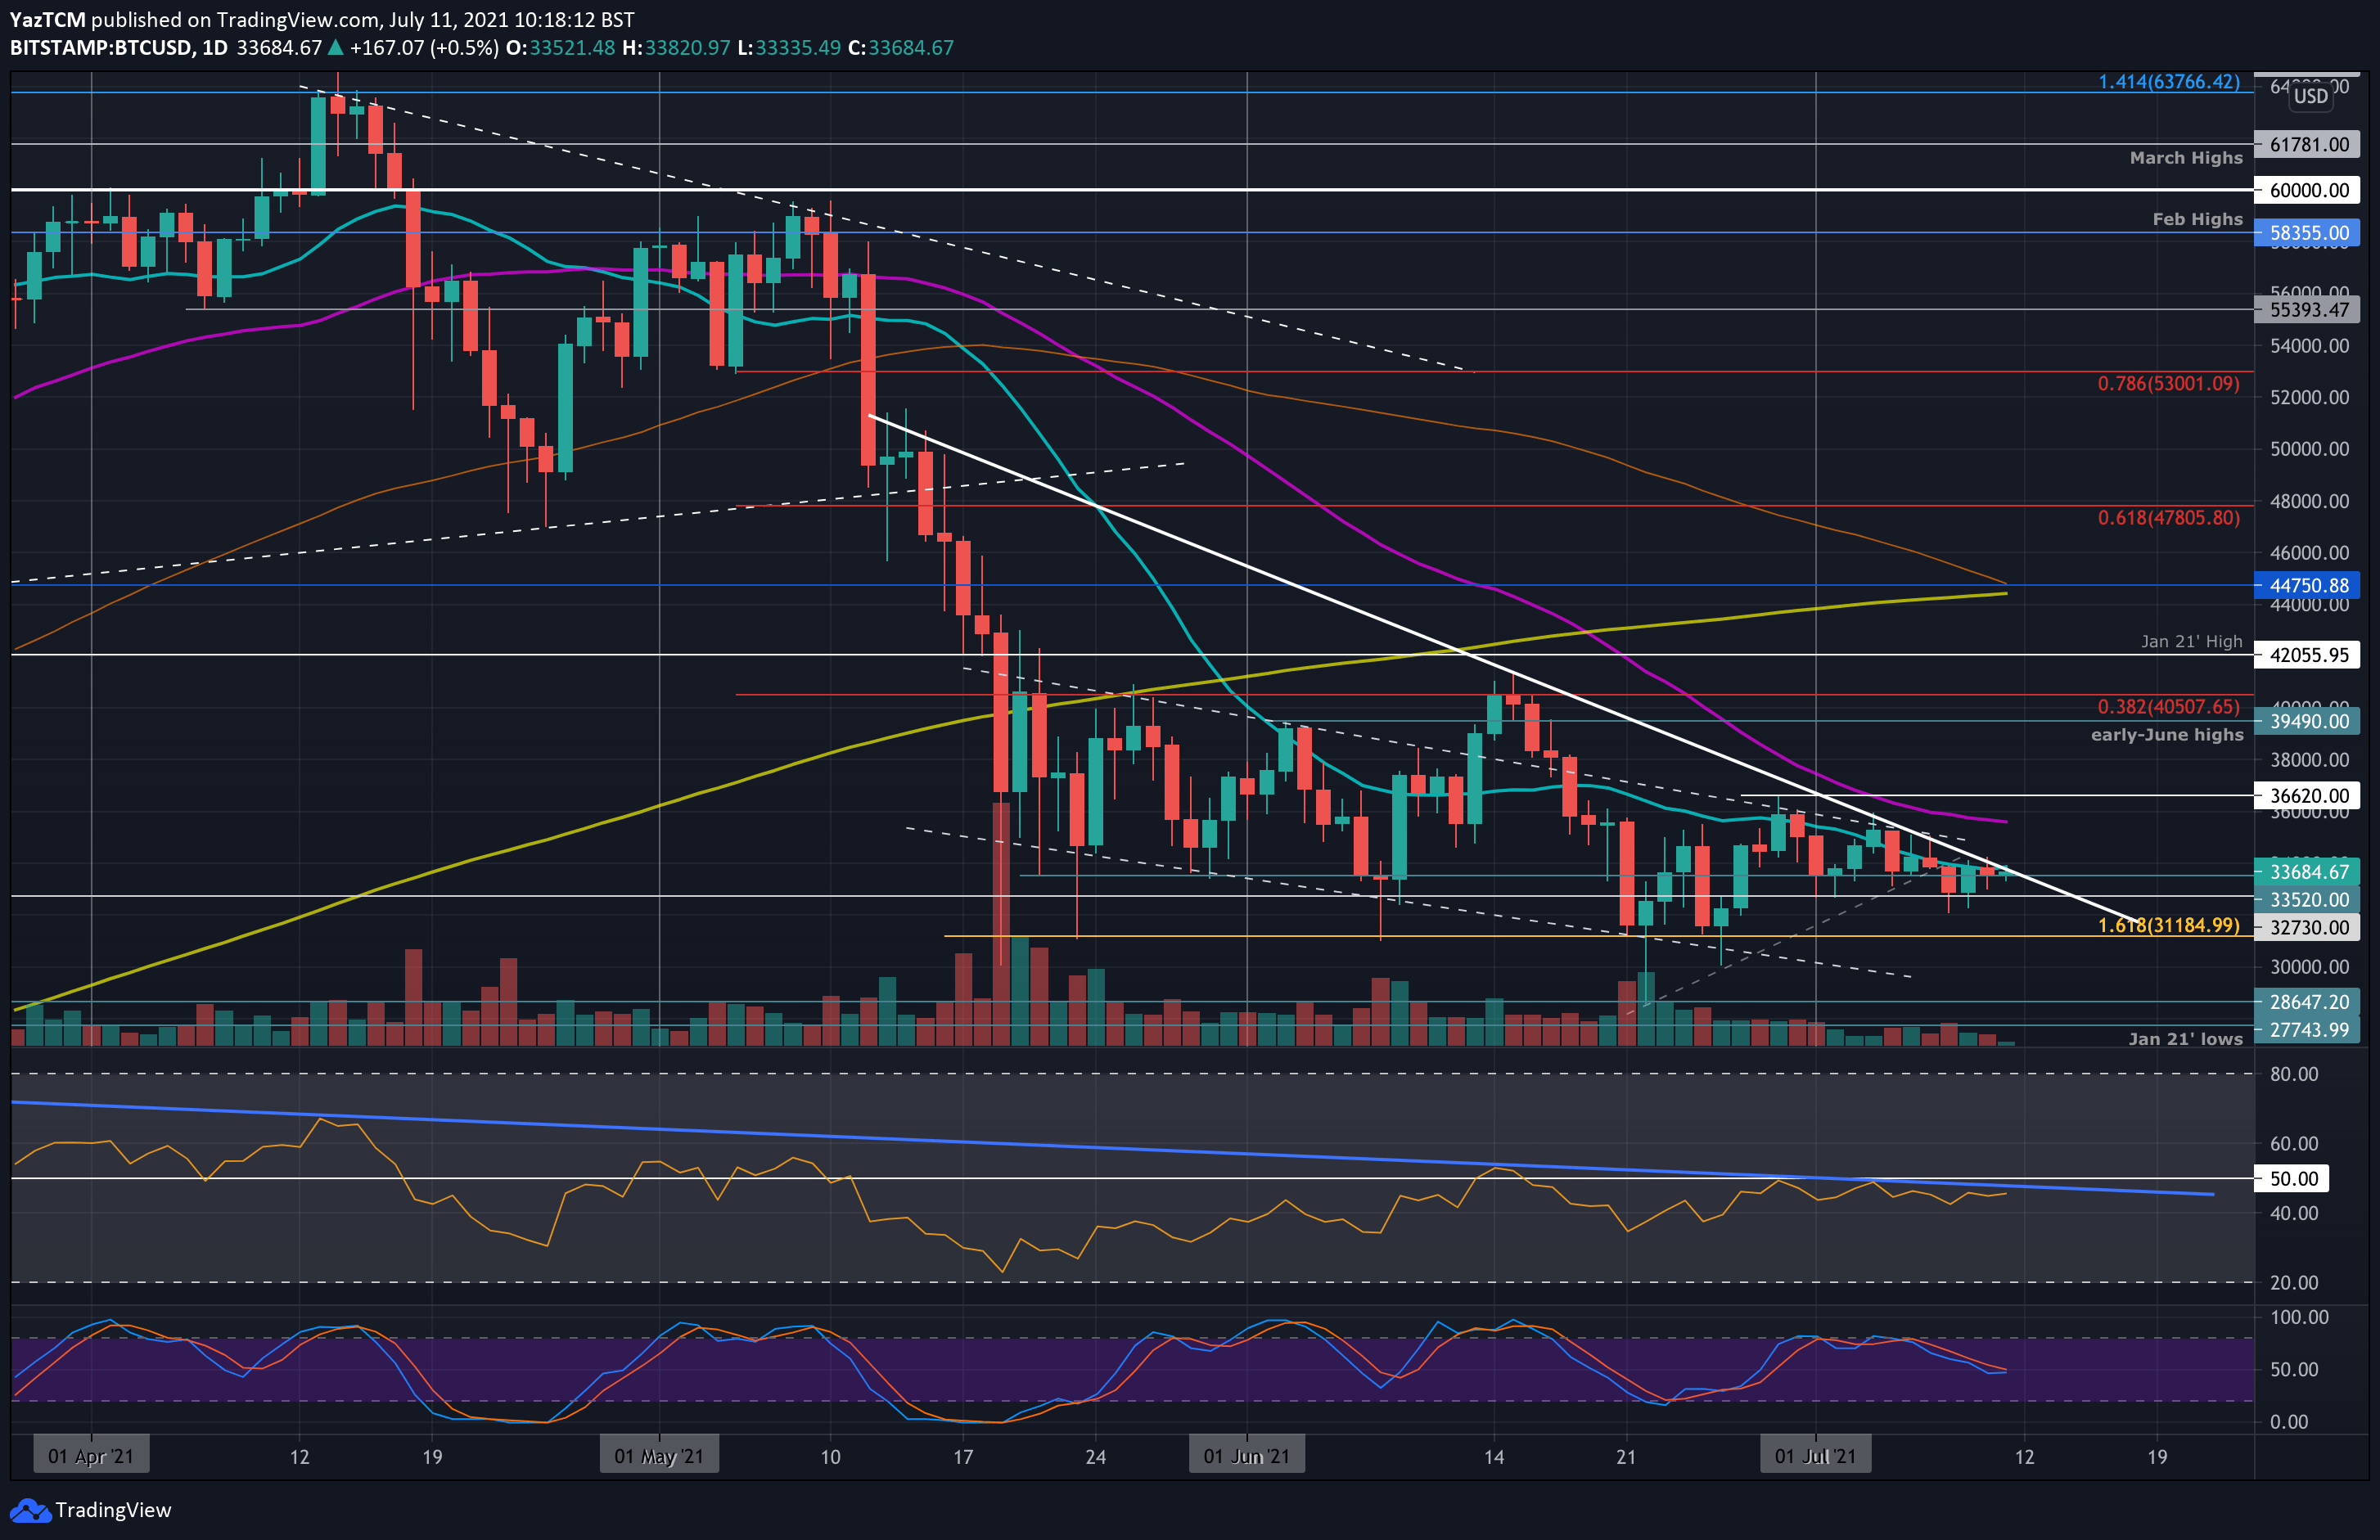
BTC/USD Daily Chart. Source: TradingView.
Bitstamp BTC/USD 4-Hour Chart
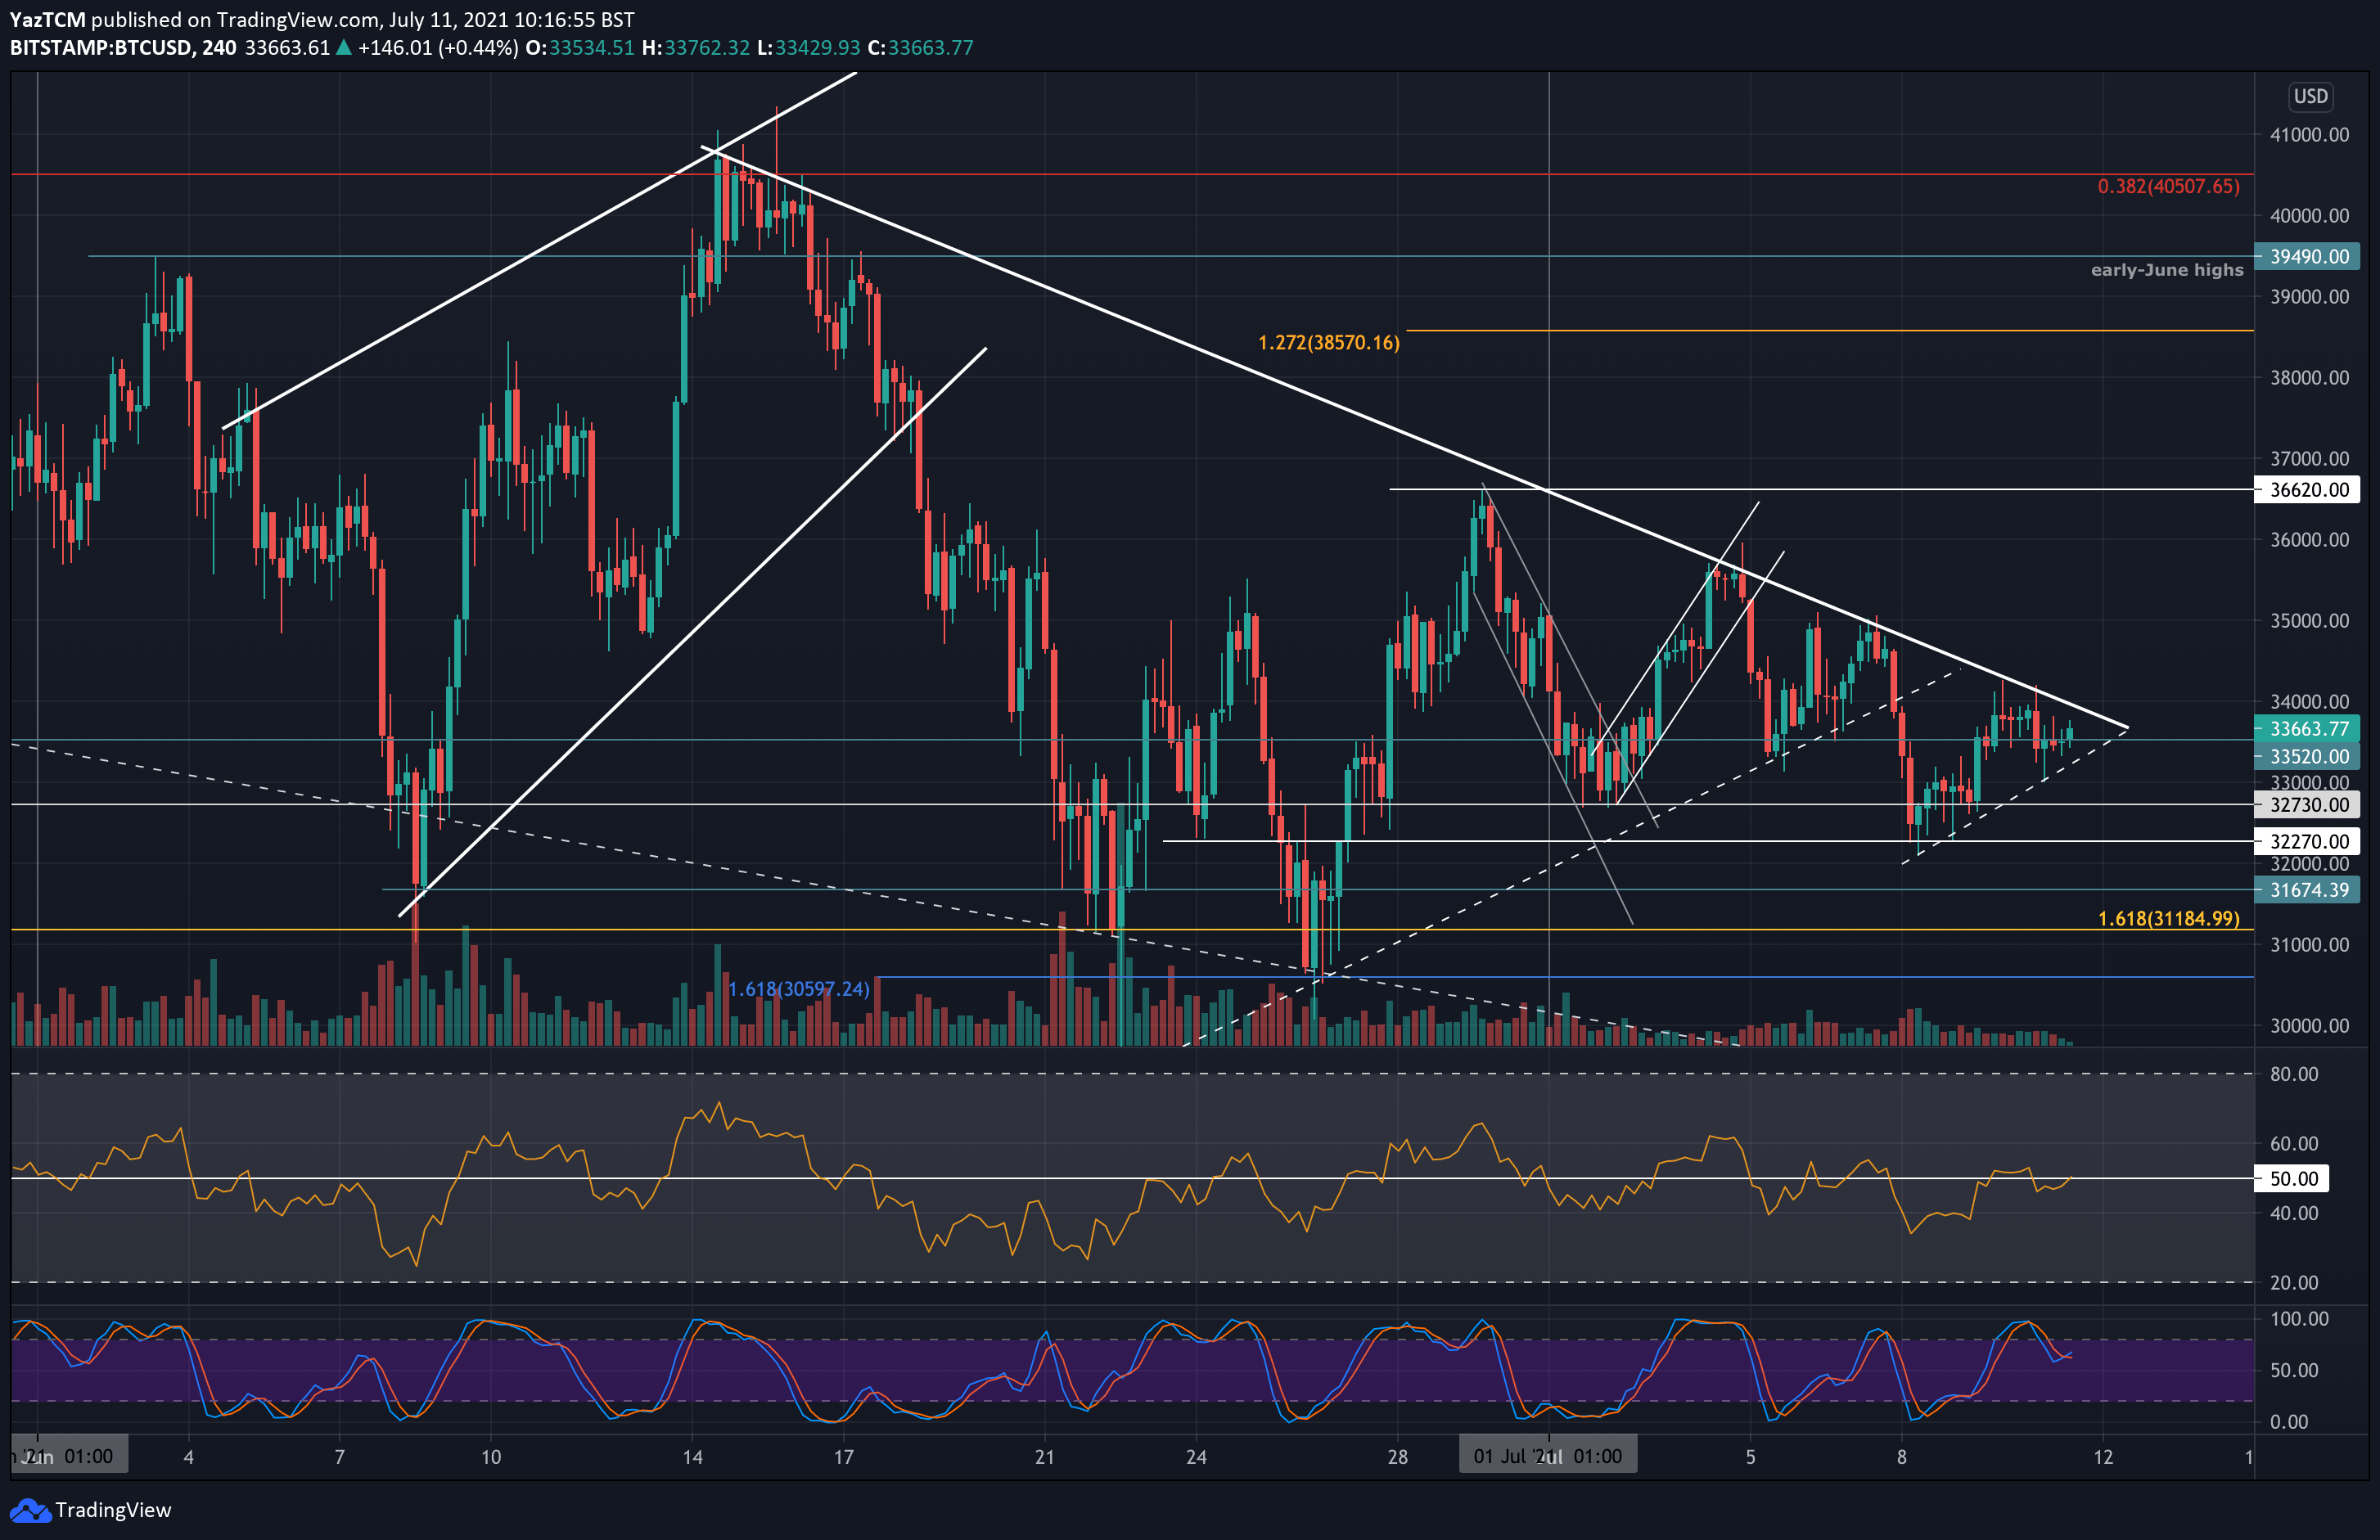
BTC/USD 4-Hour Chart. Source: TradingView.


