Bitcoin TA: Here’s Why BTC Remains At A Risk of Fresh Drop

Bitcoin price failed to clear the key $40,000 resistance zone against the US Dollar. BTC is correcting gains and it remains at a risk of more losses towards $36,000 or $34,000.

Bitcoin is struggling to clear the $40,000 and $40,500 resistance levels.
The price is currently holding the $37,000 support and the 100 hourly simple moving average.
There was a break below a short-term contracting triangle with support near $38,400 on the hourly chart of the BTC/USD pair (data feed from Kraken).
The pair is likely to accelerate lower if it breaks the $37,000 support and the 100 hourly SMA.

Bitcoin Price Struggles Below $40K

Bitcoin broke the $40,000 resistance and extended its recovery wave. BTC even cleared the $40,500 level and settled well above the 100 hourly simple moving average.

However, the bulls failed to gain strength above $40,500. A high was formed near $40,923 and the price corrected lower. There was a break below the $40,000 support level. Moreover, there was a break below a short-term contracting triangle with support near $38,400 on the hourly chart of the BTC/USD pair.

The pair gained pace below the 50% Fib retracement level of the upward move from the $36,472 low to $40,923 high. Bitcoin is currently holding the $37,000 support and the 100 hourly simple moving average.

Source: BTCUSD on TradingView.com

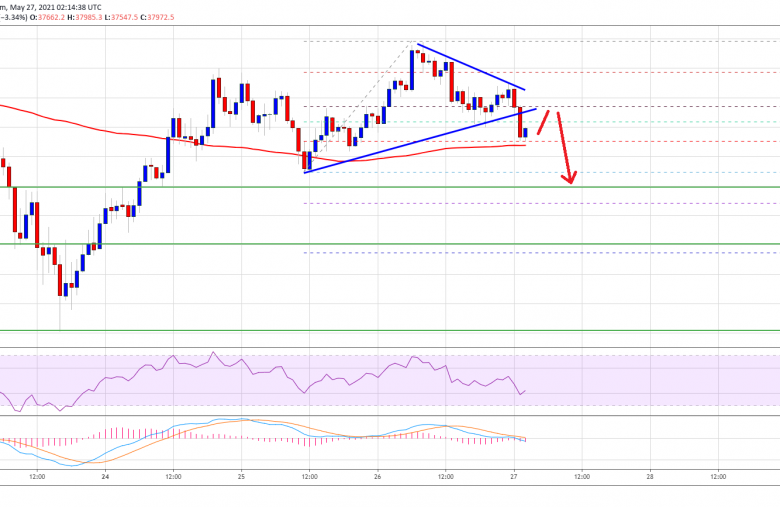
The 76.4% Fib retracement level of the upward move from the $36,472 low to $40,923 high is also acting as a support zone. On the upside, an immediate resistance is near the broken triangle support at $38,500. The first major resistance is near the $39,500 level. The main resistance is still near the $40,000 zone. A proper close above the $40,000 resistance zone could start a strong increase.

More Losses in BTC?

If bitcoin fails to clear the $39,500 resistance, there is a risk of more downsides. An initial support on the downside is near the $37,000 level.

The first major support is near the $36,000 pivot level. If there is a downside break below the $36,000 support, the price could decline towards the $34,000 support zone in the near term.

Technical indicators:

Hourly MACD – The MACD is now gaining pace in the bearish zone.

Hourly RSI (Relative Strength Index) – The RSI for BTC/USD is now below the 50 level.

Major Support Levels – $37,500, followed by $36,000.

Major Resistance Levels – $38,500, $39,500 and $40,000.

Leave a Reply