
BTC At Critical Decision Point As $40K Being Tested (Bitcoin Price Analysis)
Bitcoin is up by a total of 20% this week and it’s back at the $40K mark range.
Quick recap: BTC bounced from $34,760 on Sunday and surged even more on Monday to break the early June significant highs at $39,500 and even reach resistance at $40,760 (bearish .382 Fib Retracement).
The bullish momentum stalled slightly since reaching the resistance at $40,760 but manages to remain above $39,500 (early-June highs) and created a short-term tight trading range.
In addition, BTC is trading above a short-term rising trend line and is also trading inside a rising wedge formation, which is all best seen on the following 4-hour chart. Rising wedge tends to be a bearish formation, but often in bull markets we see a bullish breakout of the pattern.
Another way to look at it is the short-term rising trend line and the resistance at $40,760 are creating the formation of a short-term ascending triangle pattern.
From the bullish side, there are small hints that BTC should push higher and finally break $40,760 soon as there is hidden bullish divergence on the 4-hour RSI, with the RSI making lower lows and price action making higher lows. Despite that, Bitcoin still marks $42K zone as the next major level of resistance, which includes previous January 2021 highs and the 200-days moving average line.
BTC Price Support and Resistance Levels to Watch
Key Support Levels: $40,000, $39,500, $38,430, $36,750, $34,760.
Key Resistance Levels: $40,760, $42,000, $42,720, $43,600 – $44,000, $44,750.
Looking ahead, if the buyers break resistance at $40,760 (bearish .382 Fib), the first resistance lies at $42,000 (Jan 2021 highs). This is followed by $42,720 (1.272 Fib Extension & 200-day MA), $43,600 (1.414 Fib Extension), $44,000 (50-day MA),and $44,750. Added resistance lies at $46,000 and $47,360 (bearish .618 Fib).
On the other side, the first major support lies at $40,000. This is followed by $39,500 (early-June highs), $38,430 (4-hour’s MA-200 line), $36,750 (.786 Fib & 20-day MA), and $34,760 (downside 1.414 Fib Extension).
As mentioned, the 4-hour RSI is showing hints of hidden bullish divergence. Additionally, the RSI is now showing the highest level of bullish momentum since mid-May 2021 – before the market crash. This suggests that the buyers might be starting the recovery.
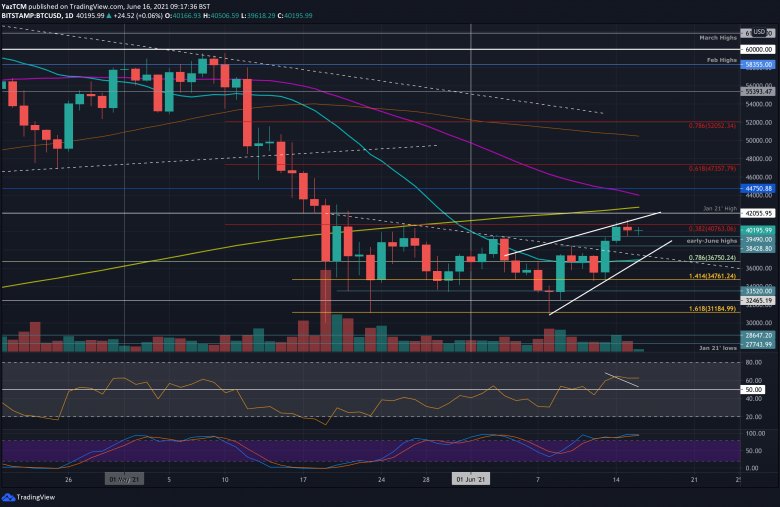
Bitstamp BTC/USD Daily Chart
BTC/USD Daily Chart. Source: TradingView.
Bitstamp BTC/USD 4-Hour Chart

BTC/USD 4-Hour Chart. Source: TradingView.


