
Cardano Price Analysis: ADA Consolidation Around $1.2 Continues, Huge Move Inbound?
ADA/USD – Rangebound Trading Continues
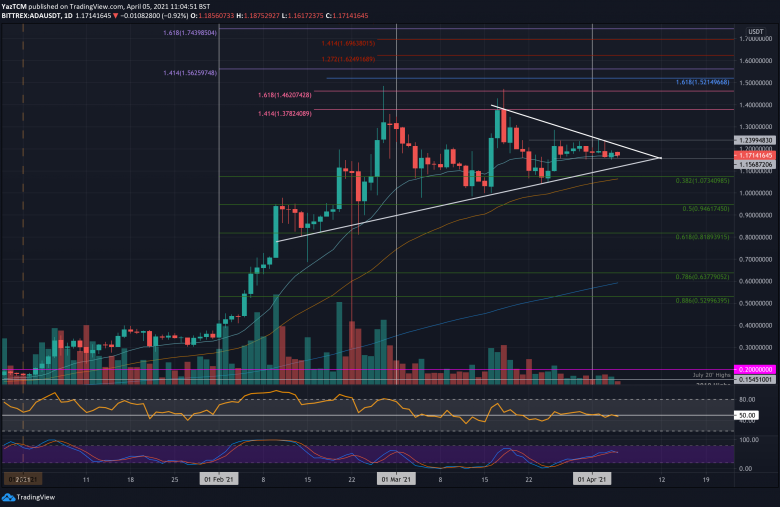
Key Support Levels: $1.15, $1.07, $1.00.
Key Resistance Levels: $1.20, $1.24, $1.30.
ADA has been trapped between $1.24 and $1.15 for the past eleven days of trading. Alongside this narrow range, ADA is also trading inside a short-term symmetrical triangle pattern as it continues to consolidate toward the apex. Additionally, it is doing well to hold above the 20-day EMA.
A breakout of this range should dictate the next direction of trading for ADA, with a breakout toward the upside setting the stage for a bull run back toward the ATH around $1.48.

ADA-USD Short Term Price Prediction
Looking ahead, the first level of resistance lies at the upper boundary of the triangle, at around $1.20. This is followed by the upper boundary of the narrow trading range $1.24, $1.30, $1.37 (1.414 Fib Extension), and $1.48 (ATH price).
On the other side, the first support lies at $1.15. This is followed by the lower boundary of the triangle, $1.07 (.382 Fib & 100-days EMA), $1.00, and $0.95 (.5 Fib).
The RSI is trading along the midline, indicating the indecision within the market. For a positive breakout, the RSI must rise and break above the midline to indicate bullish momentum is returning to the market.
ADA/BTC – Consolidation Inside Triangle Continues
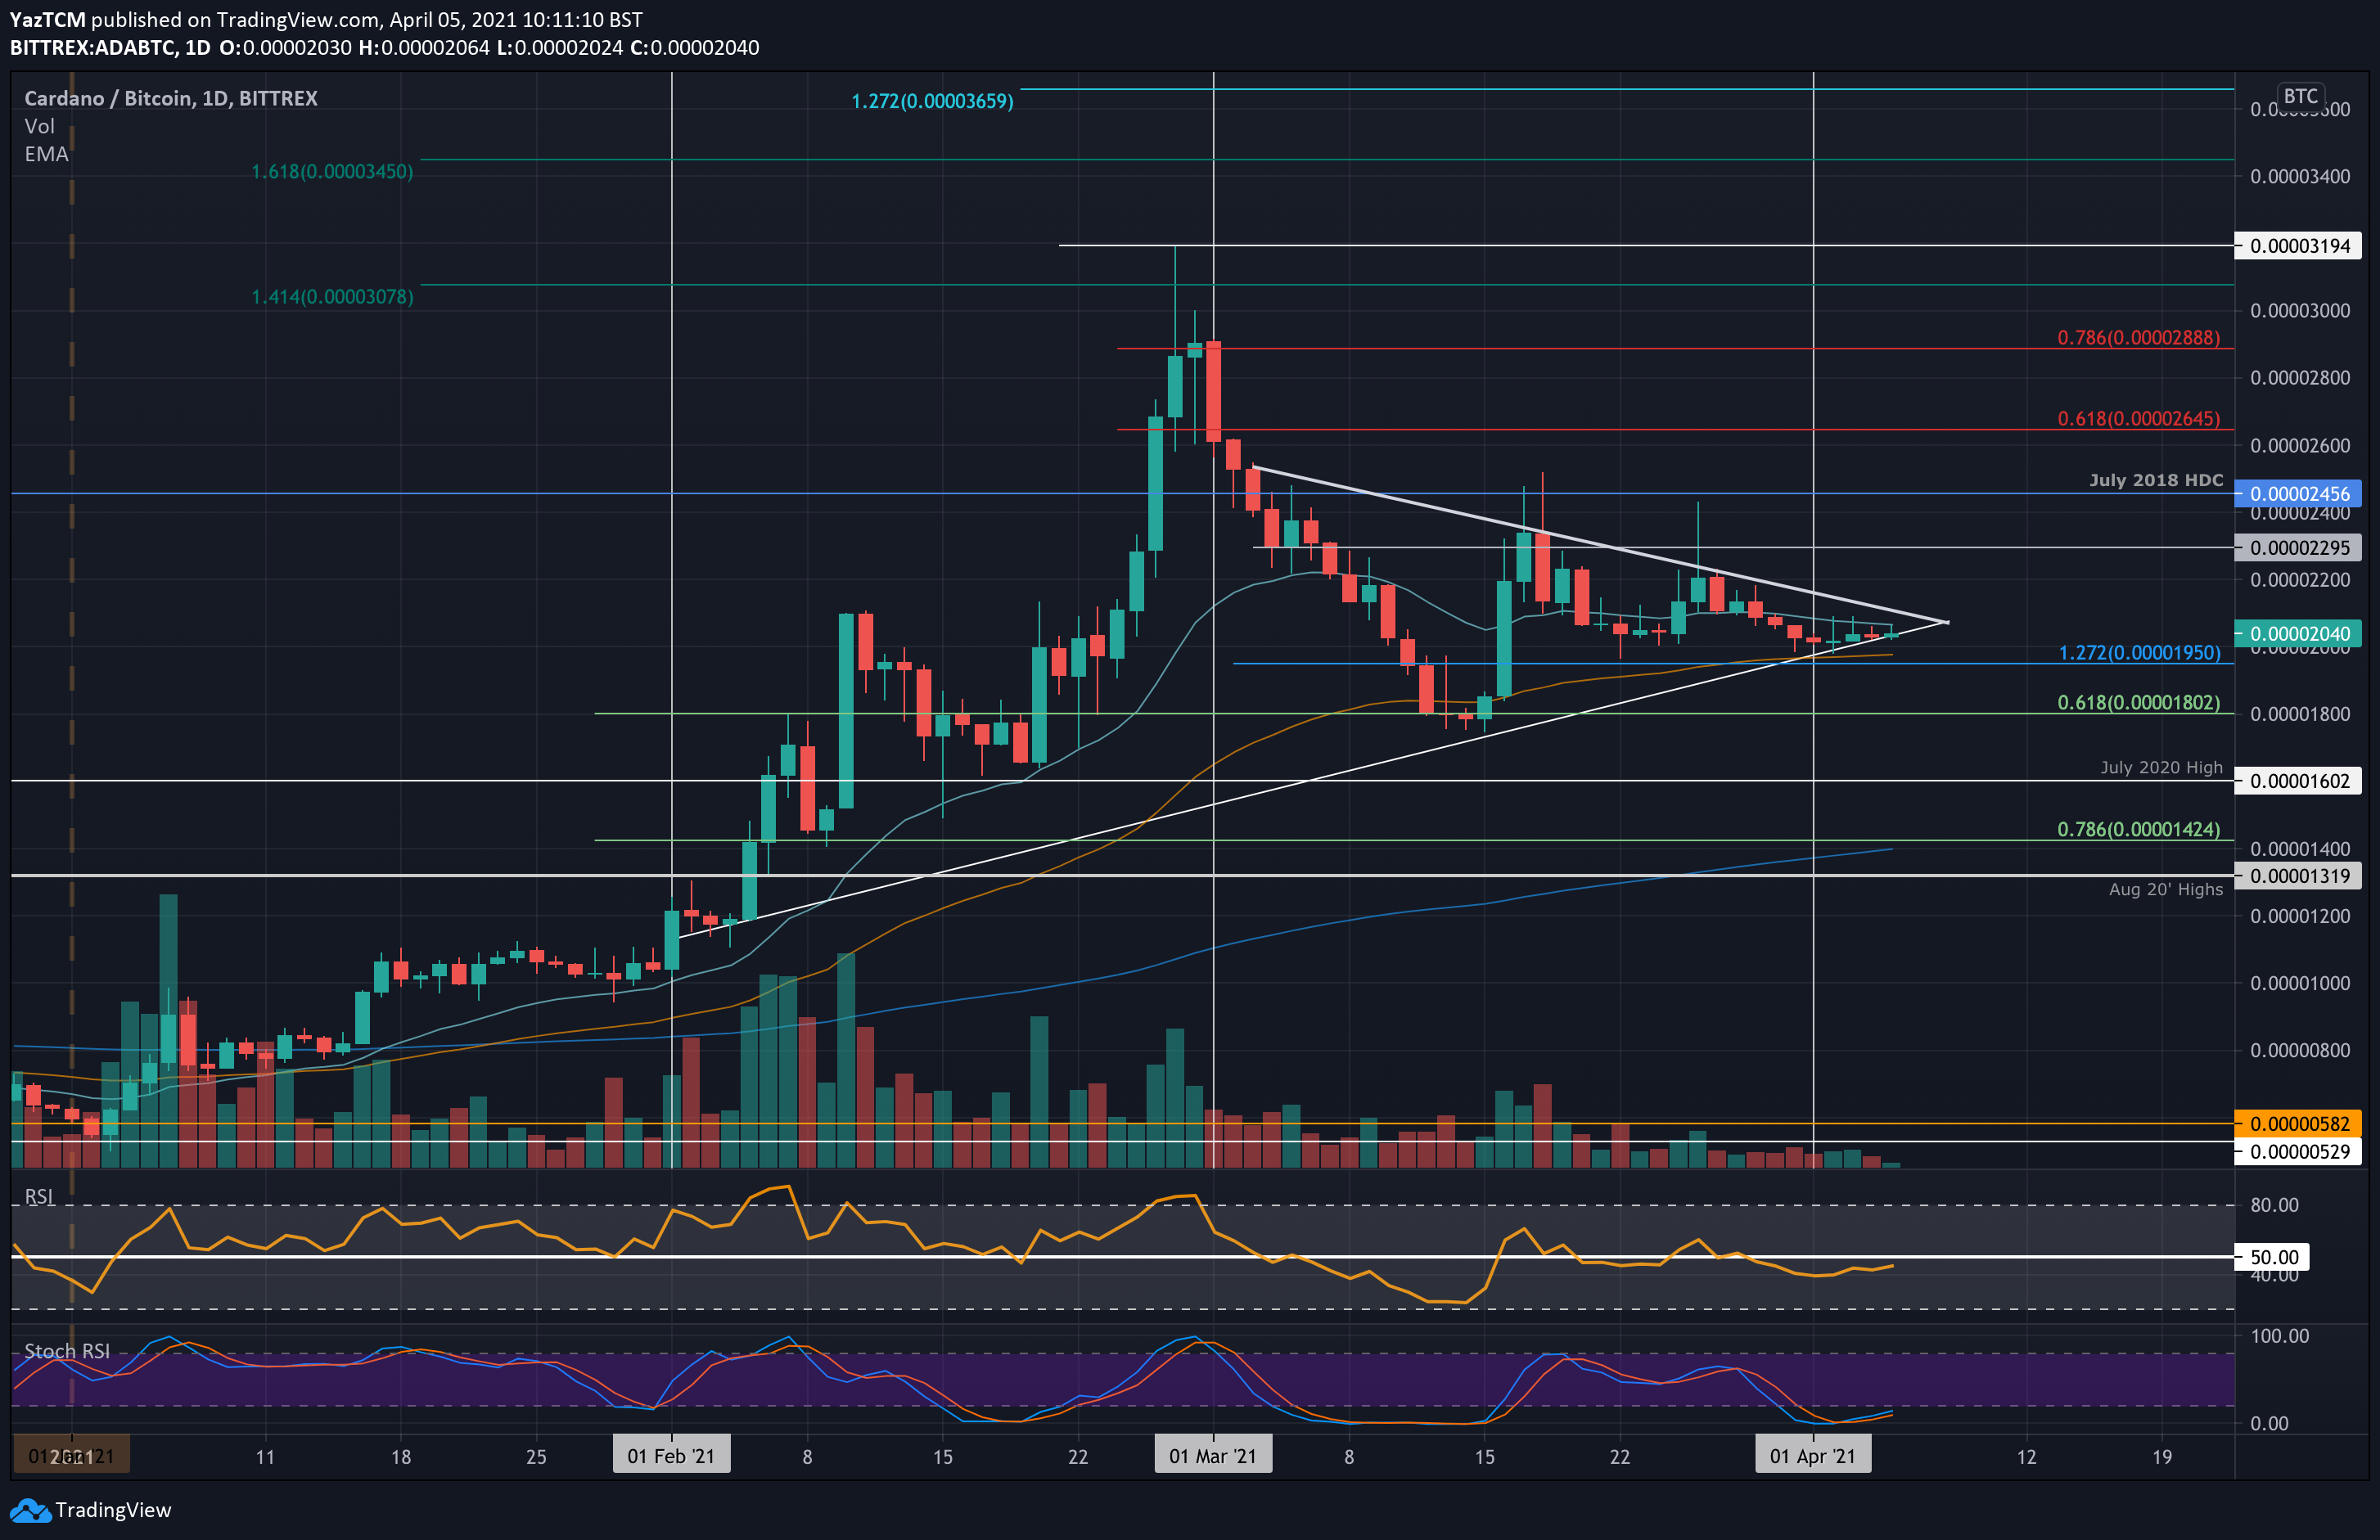
Key Support Levels: 2000 SAT, 1950 SAT, 1800 SAT.
Key Resistance Levels: 2200 SAT, 2300 SAT, 2455 SAT.
Against Bitcoin, ADA continues to move inside the symmetrical triangle that it has been trading within throughout the entire period of March.
The cryptocurrency struggled to break the upper boundary of this triangle throughout March but has found solid support at 2000 SAT during the first days of April as it trades along the lower boundary of the triangle.
ADA-BTC Short Term Price Prediction
Looking ahead, if the bulls push higher, the first resistance lies at the upper angle of the triangle. This is followed by 2200 SAT, 2300 SAT, 2455 SAT (July 2018 High-day close), and 2645 SAT (bearish .618 Fib).
On the other side, the first support lies at 2000 SAT. This is followed by 1950 SAT (100-days EMA), 1800 SAT (.618 Fib), and 1600 SAT (July 2020 High).
The RSI is trading slightly beneath the midline, indicating weak bearish momentum, but it slowly rises. A break above the midline would allow ADA to finally break toward the upside of the triangle. Additionally, the Stochastic RSI is extremely oversold and is primed for a bullish crossover signal that could mark the end of the current consolidation phase.


