Crypto Price Analysis & Overview March 12th: Bitcoin, Ethereum, Ripple, Cardano, and Litecoin
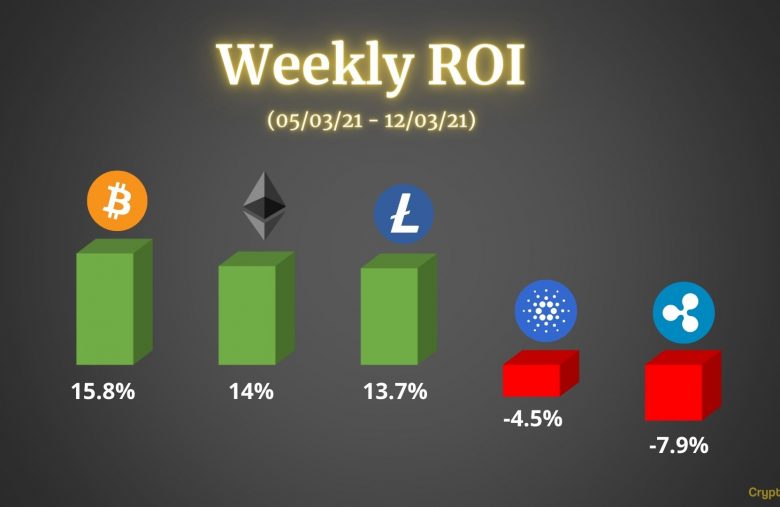
This week was quite exciting in the cryptocurrency market as a lot of the major coins managed to recover. Unfortunately, this wasn’t the case for all of them, so let’s have a look at some of the most interesting performers throughout the past seven days.
Bitcoin
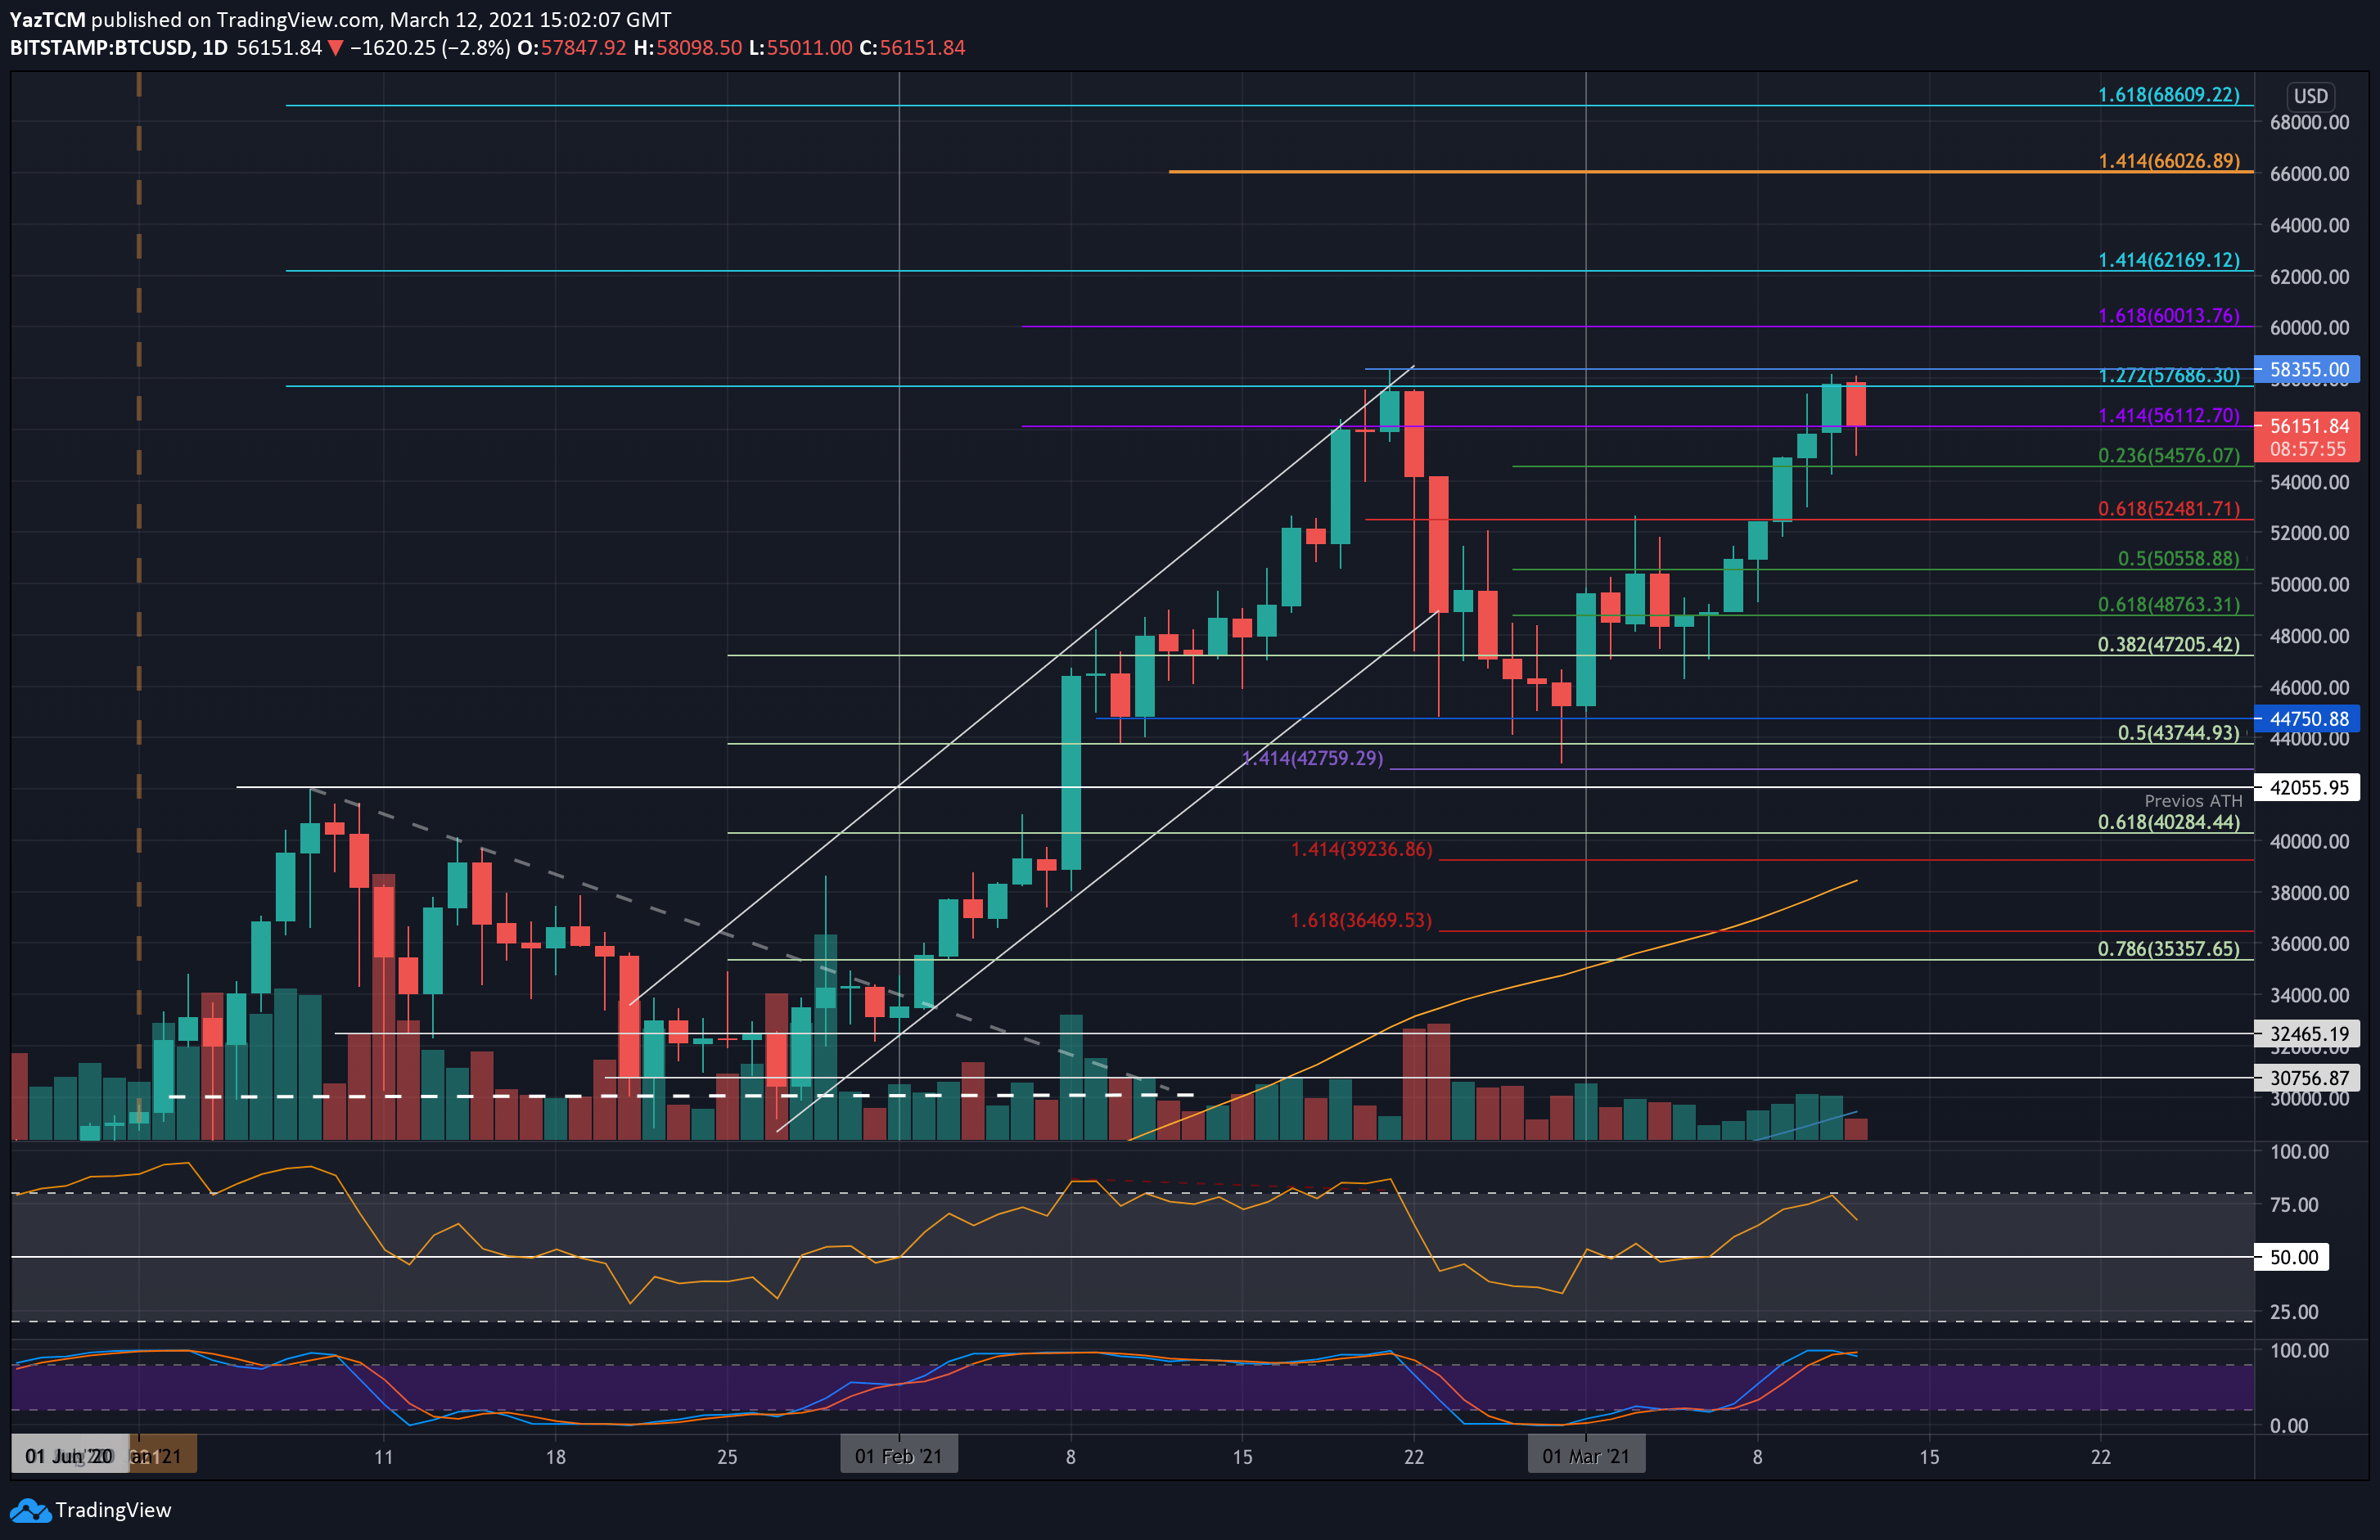
Bitcoin is up by a powerful 15.8% over the past week as the cryptocurrency edges near the ATH price again. It started the week by rebounding from support at $47,200 (.382 Fib) and began to push higher over the weekend.
The coin broke back above $50,000 on Sunday and continued higher into the early-March resistance at $52,480 (bearish .618 Fib) on Monday. As the week progressed, BTC rallied until reaching $58,000 yesterday. It has since rolled over from here to trade back at the $56,112 level.
Looking ahead, the first level of resistance lies at $57,686 (1.272 Fib Extension). This is followed by $58,355 (ATH), $60,000 (1.618 Fib Extension – purple), and $62,170 (1.414 Fib extension – blue).
Added resistance is expected at $64,000, $66,000, and $68,610.
Ethereum
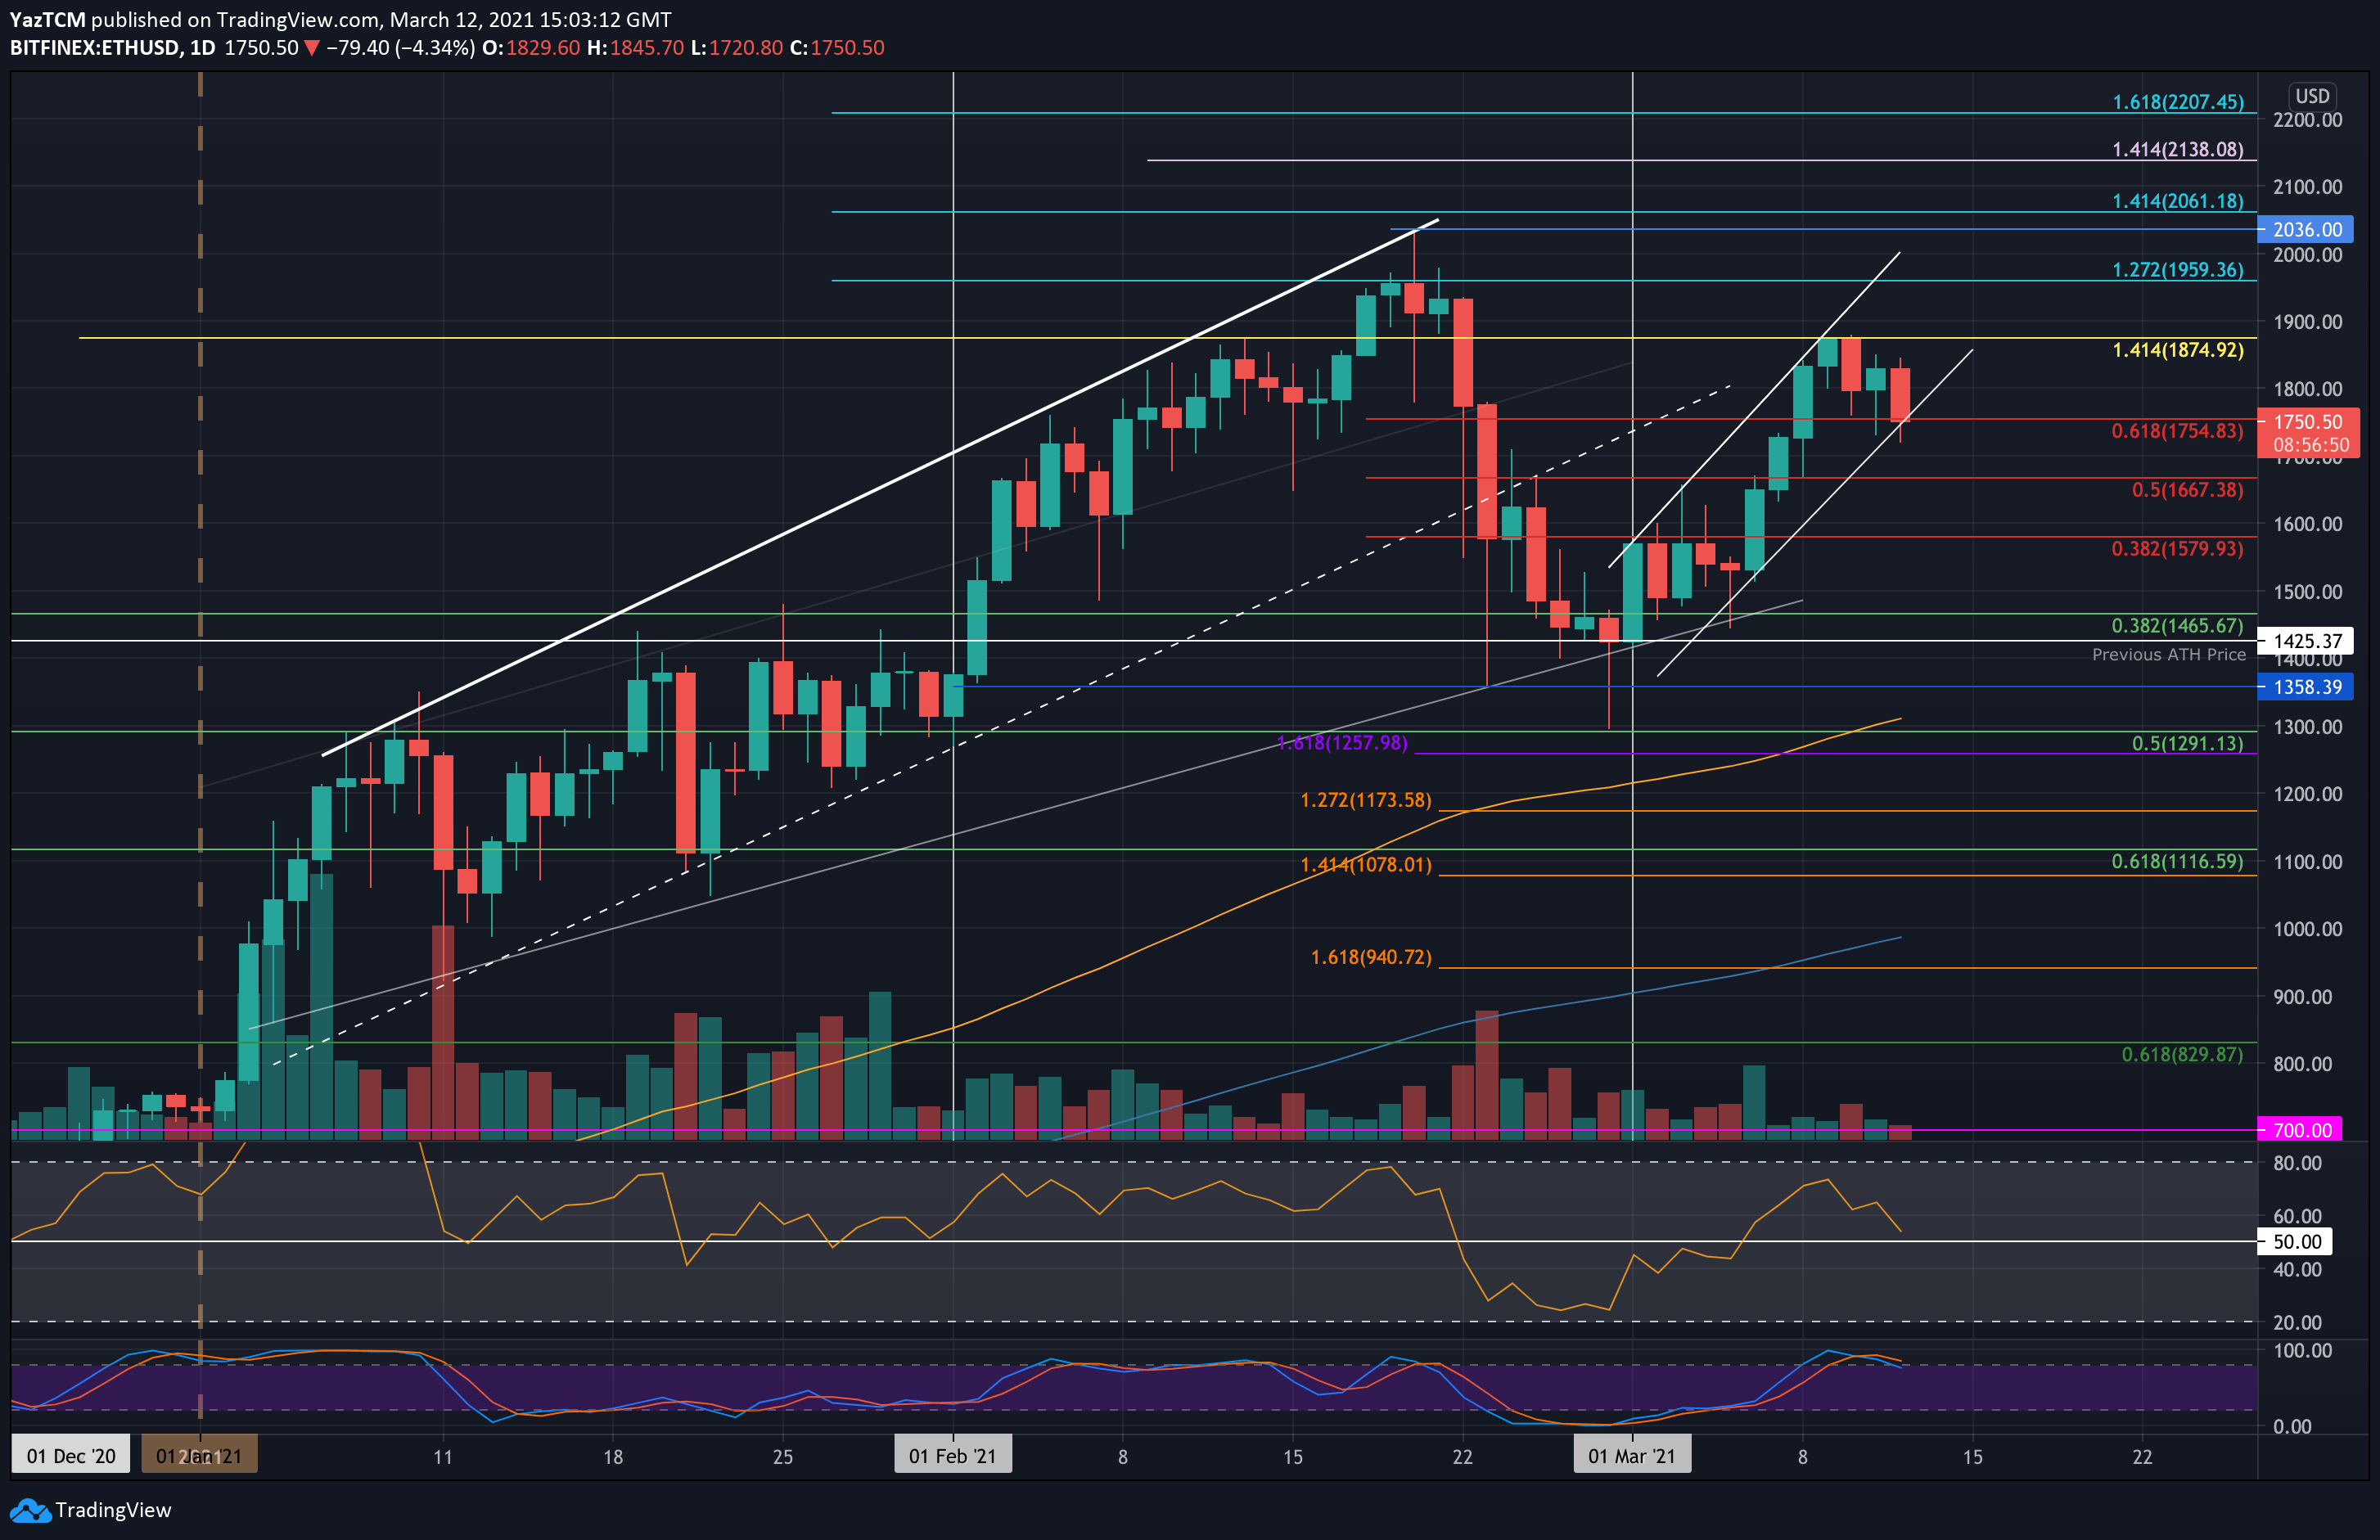
Ethereum also saw a strong surge this week after increasing by 14% to reach $1750 today. The coin rebounded from support at the lower boundary of an ascending price channel over the weekend as it started to push higher. It found resistance at $1667 (bearish .5 Fib) on Saturday and continued above this resistance on Sunday.
Ethereum then went on to spike even higher until meeting resistance at $1875 (1.414 Fib Extension – yellow) on Tuesday. It could not break this level and ended up rolling over from here as it moved sideways around $1800.
Today, ETH dropped by a total of 3.7% as it fell into the lower boundary of the ascending price channel, where it currently trades at $1750.
Looking ahead, if the sellers break the price channel, the first level of support lies at $1700. This is followed by $1667 (previous resistance), $1580, and $1500.
On the other side, the first resistance now lies at $1800. This is followed by $1875, $1960 (1.272 Fib Extension), and $2036 (ATH price).
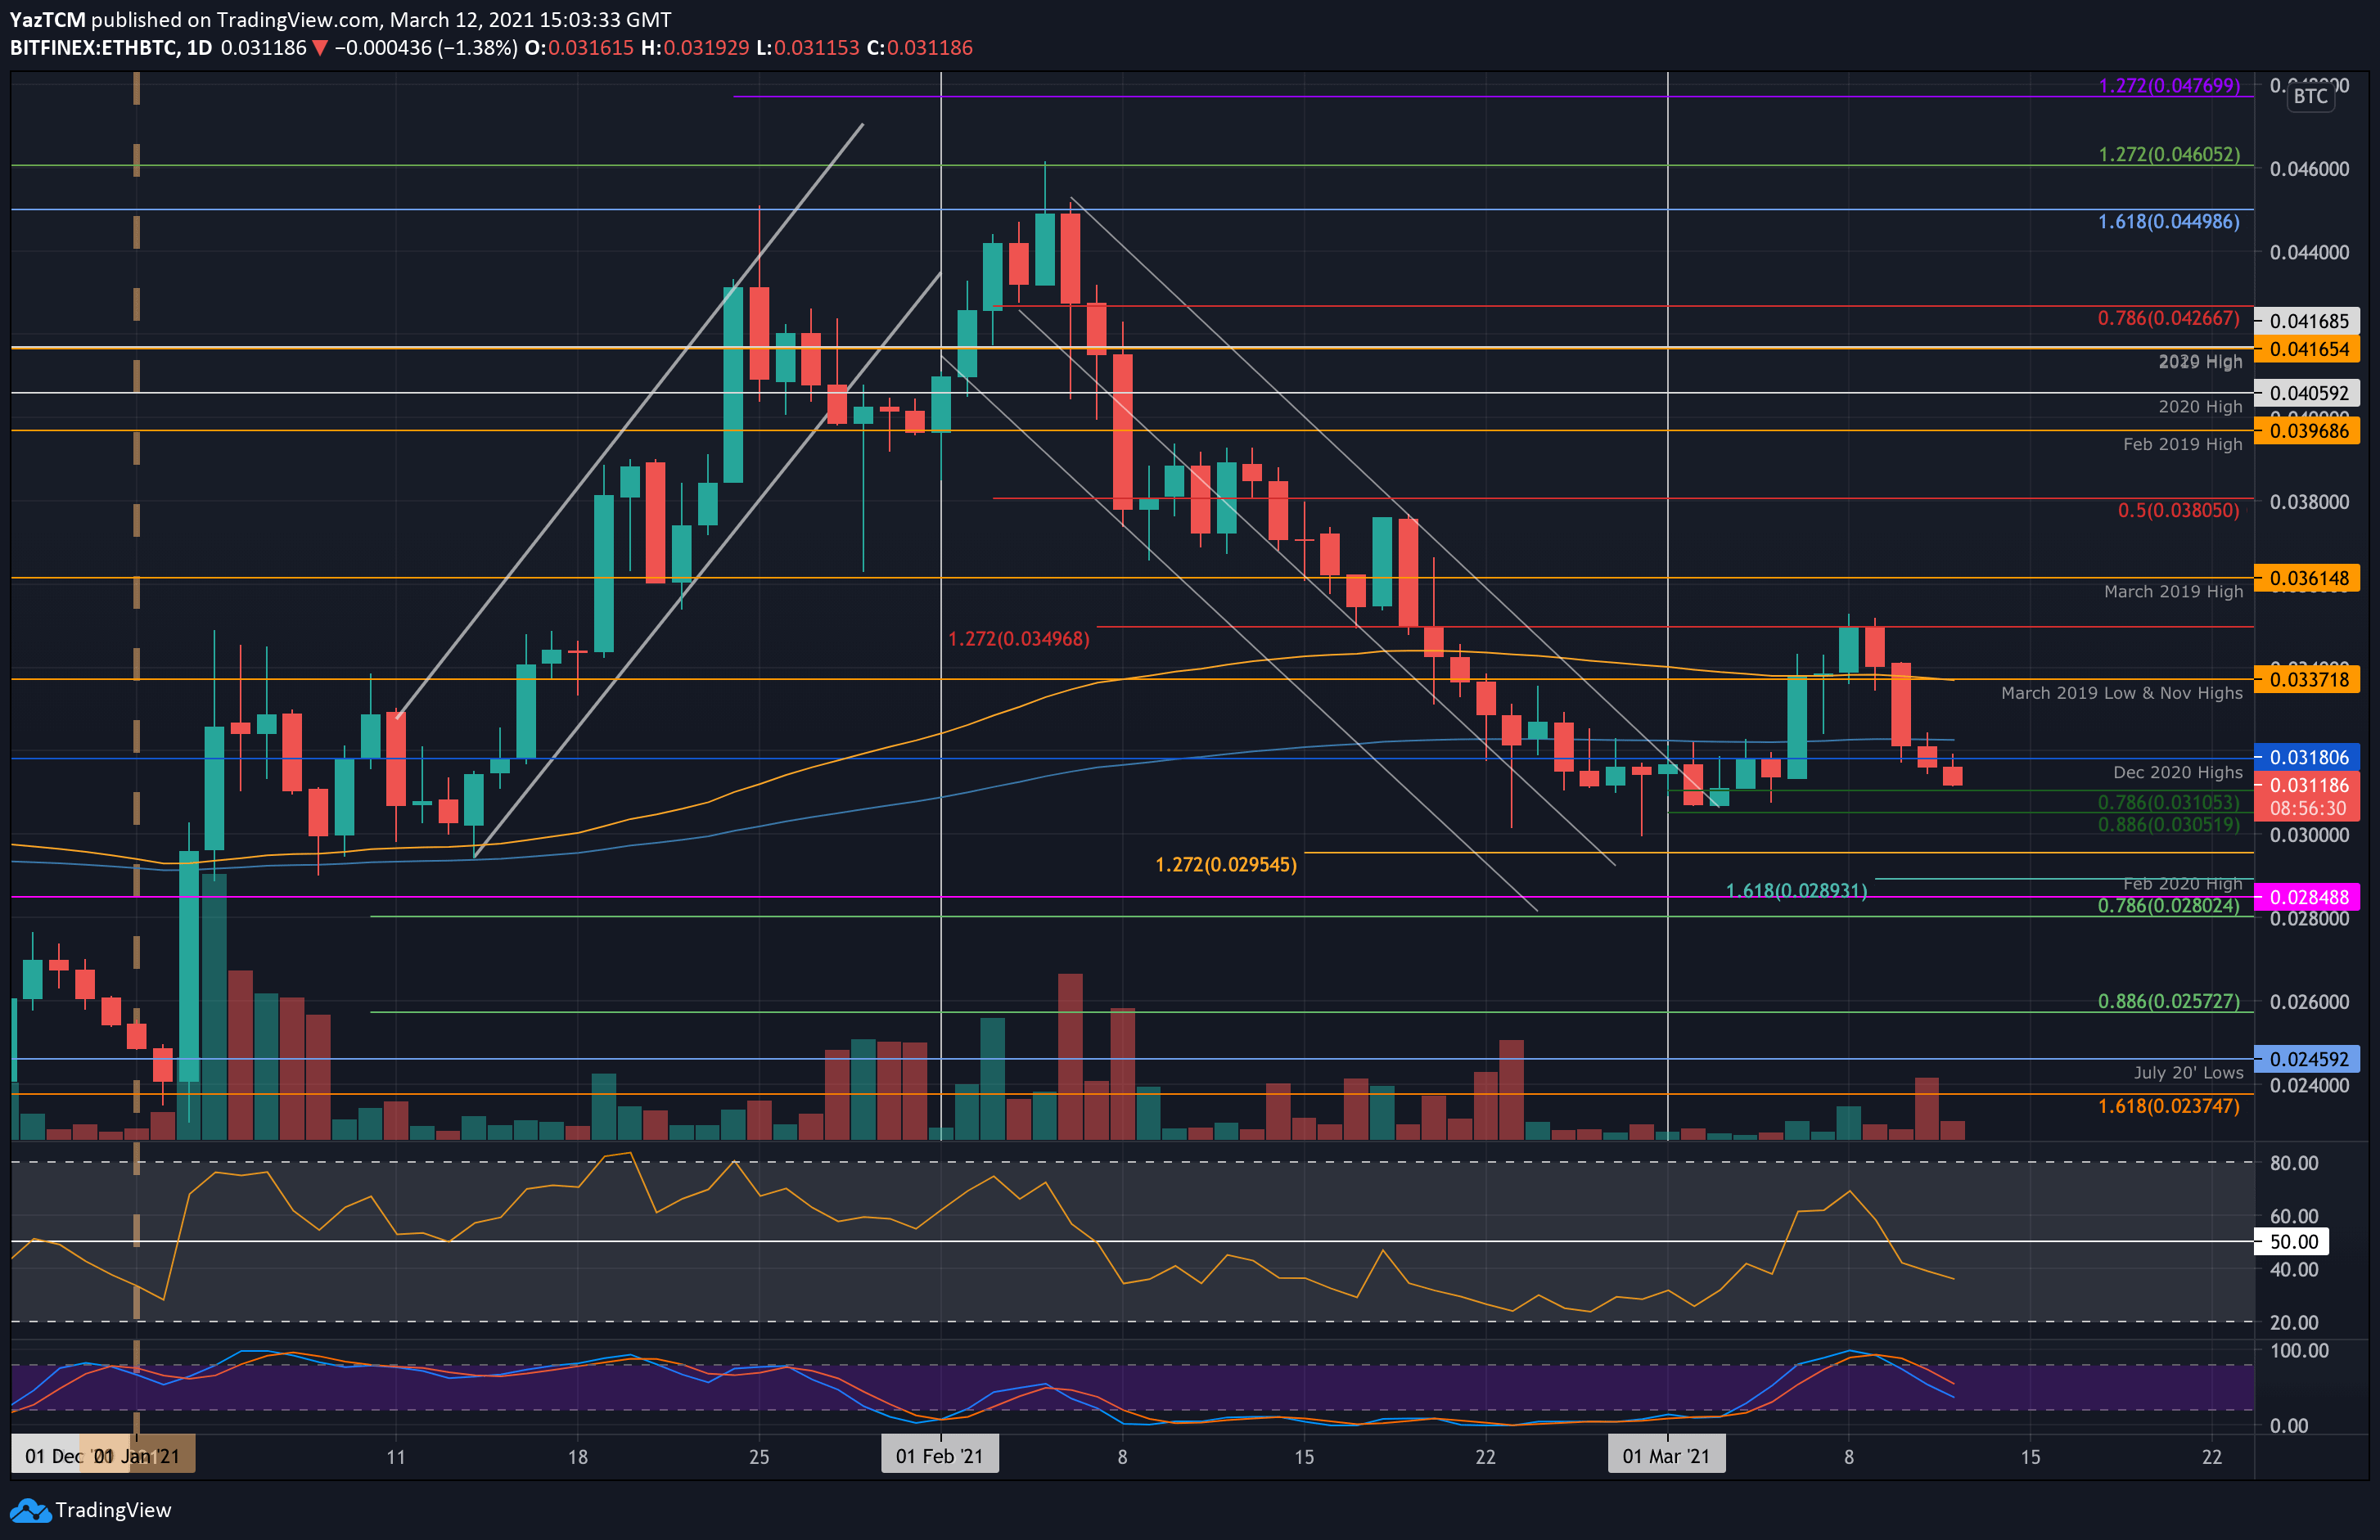
Ethereum is starting to show weakness against Bitcoin again. The coin bounced from 0.031 BTC over the weekend and went on to push as high as 0.035 BTC during the course of the week.
Unfortunately, it could not surpass 0.035 BTC and ended up rolling over from here Tuesday. Since then, Etheruem dropped beneath the 200-day EMA and continued lower to hit the 0.031 BTC support today, provided by a .786 Fib Retracement).
Looking ahead, if the sellers push beneath 0.031 BTC, the first level of support lies at 0.0305 BTC (.886 Fib Retracement). This is followed by 0.03 BTC, 0.0295 BTC (Downside 1.272 Fib Extension), and 0.0295 BTC (Feb 2020 Highs).
On the other side, the first level of resistance lies at 0.032 BTC (200-days EMA). This is followed by 0.0337 BTC (Nov 2020 highs & 100-days EMA), 0.035 BTC, and 0.0361 BTC (March 2019 Highs).
Ripple
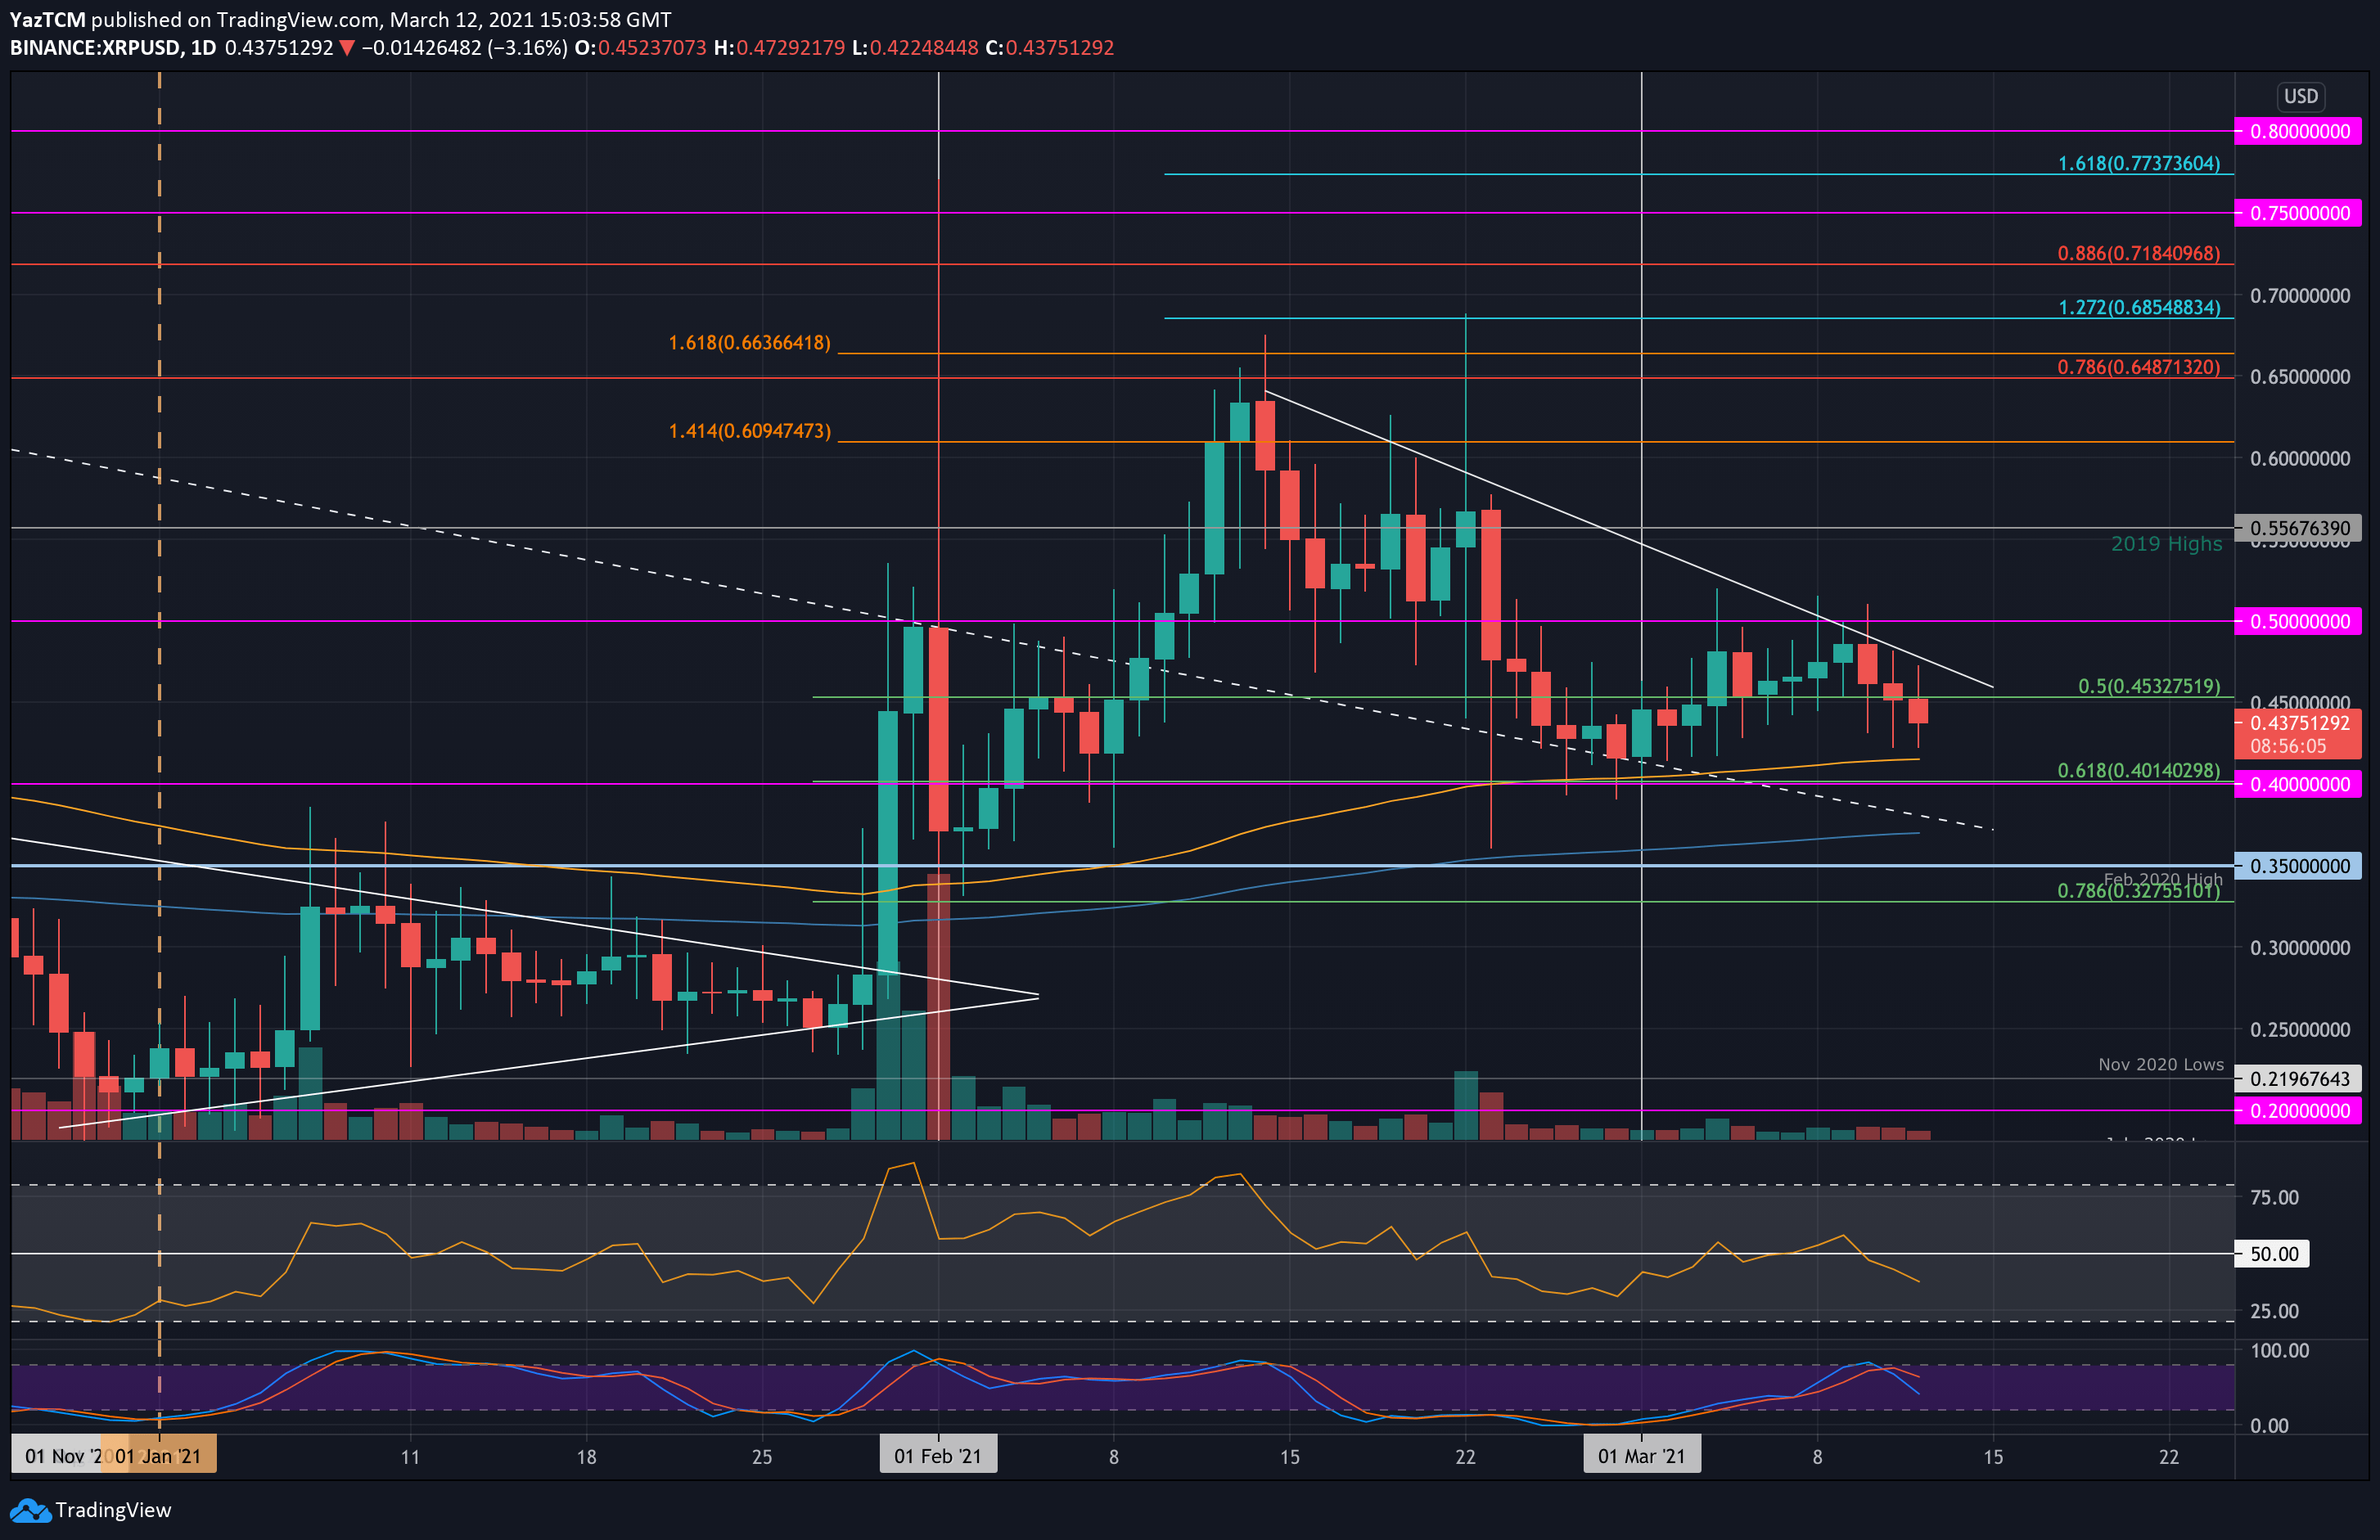
XRP suffered a 7.9% decline this week as the cryptocurrency fell beneath support at $0.45 (.5 Fib) to reach $0.437 today. XRP was doing well to hold above $0.45 for the majority of March as it attempted to push higher above a descending trend line.
On Wednesday, the coin attempted to break above $0.5 but failed to close above the descending trend line, causing it to roll over. Today, the coin fell beneath the support at $0.45 after trading above it for the past nine days.
Looking ahead, if the sellers push lower, the first level of support lies at $0.41 (100-days EMA). This is followed by $0.4 (.618 Fib), $0.37 (200-days EMA), and $0.35 (Feb 2020 High).
On the other side, the first level of resistance lies at $0.45. This is followed by the falling trend line, $0.5 and $0.556 (2019 Highs).
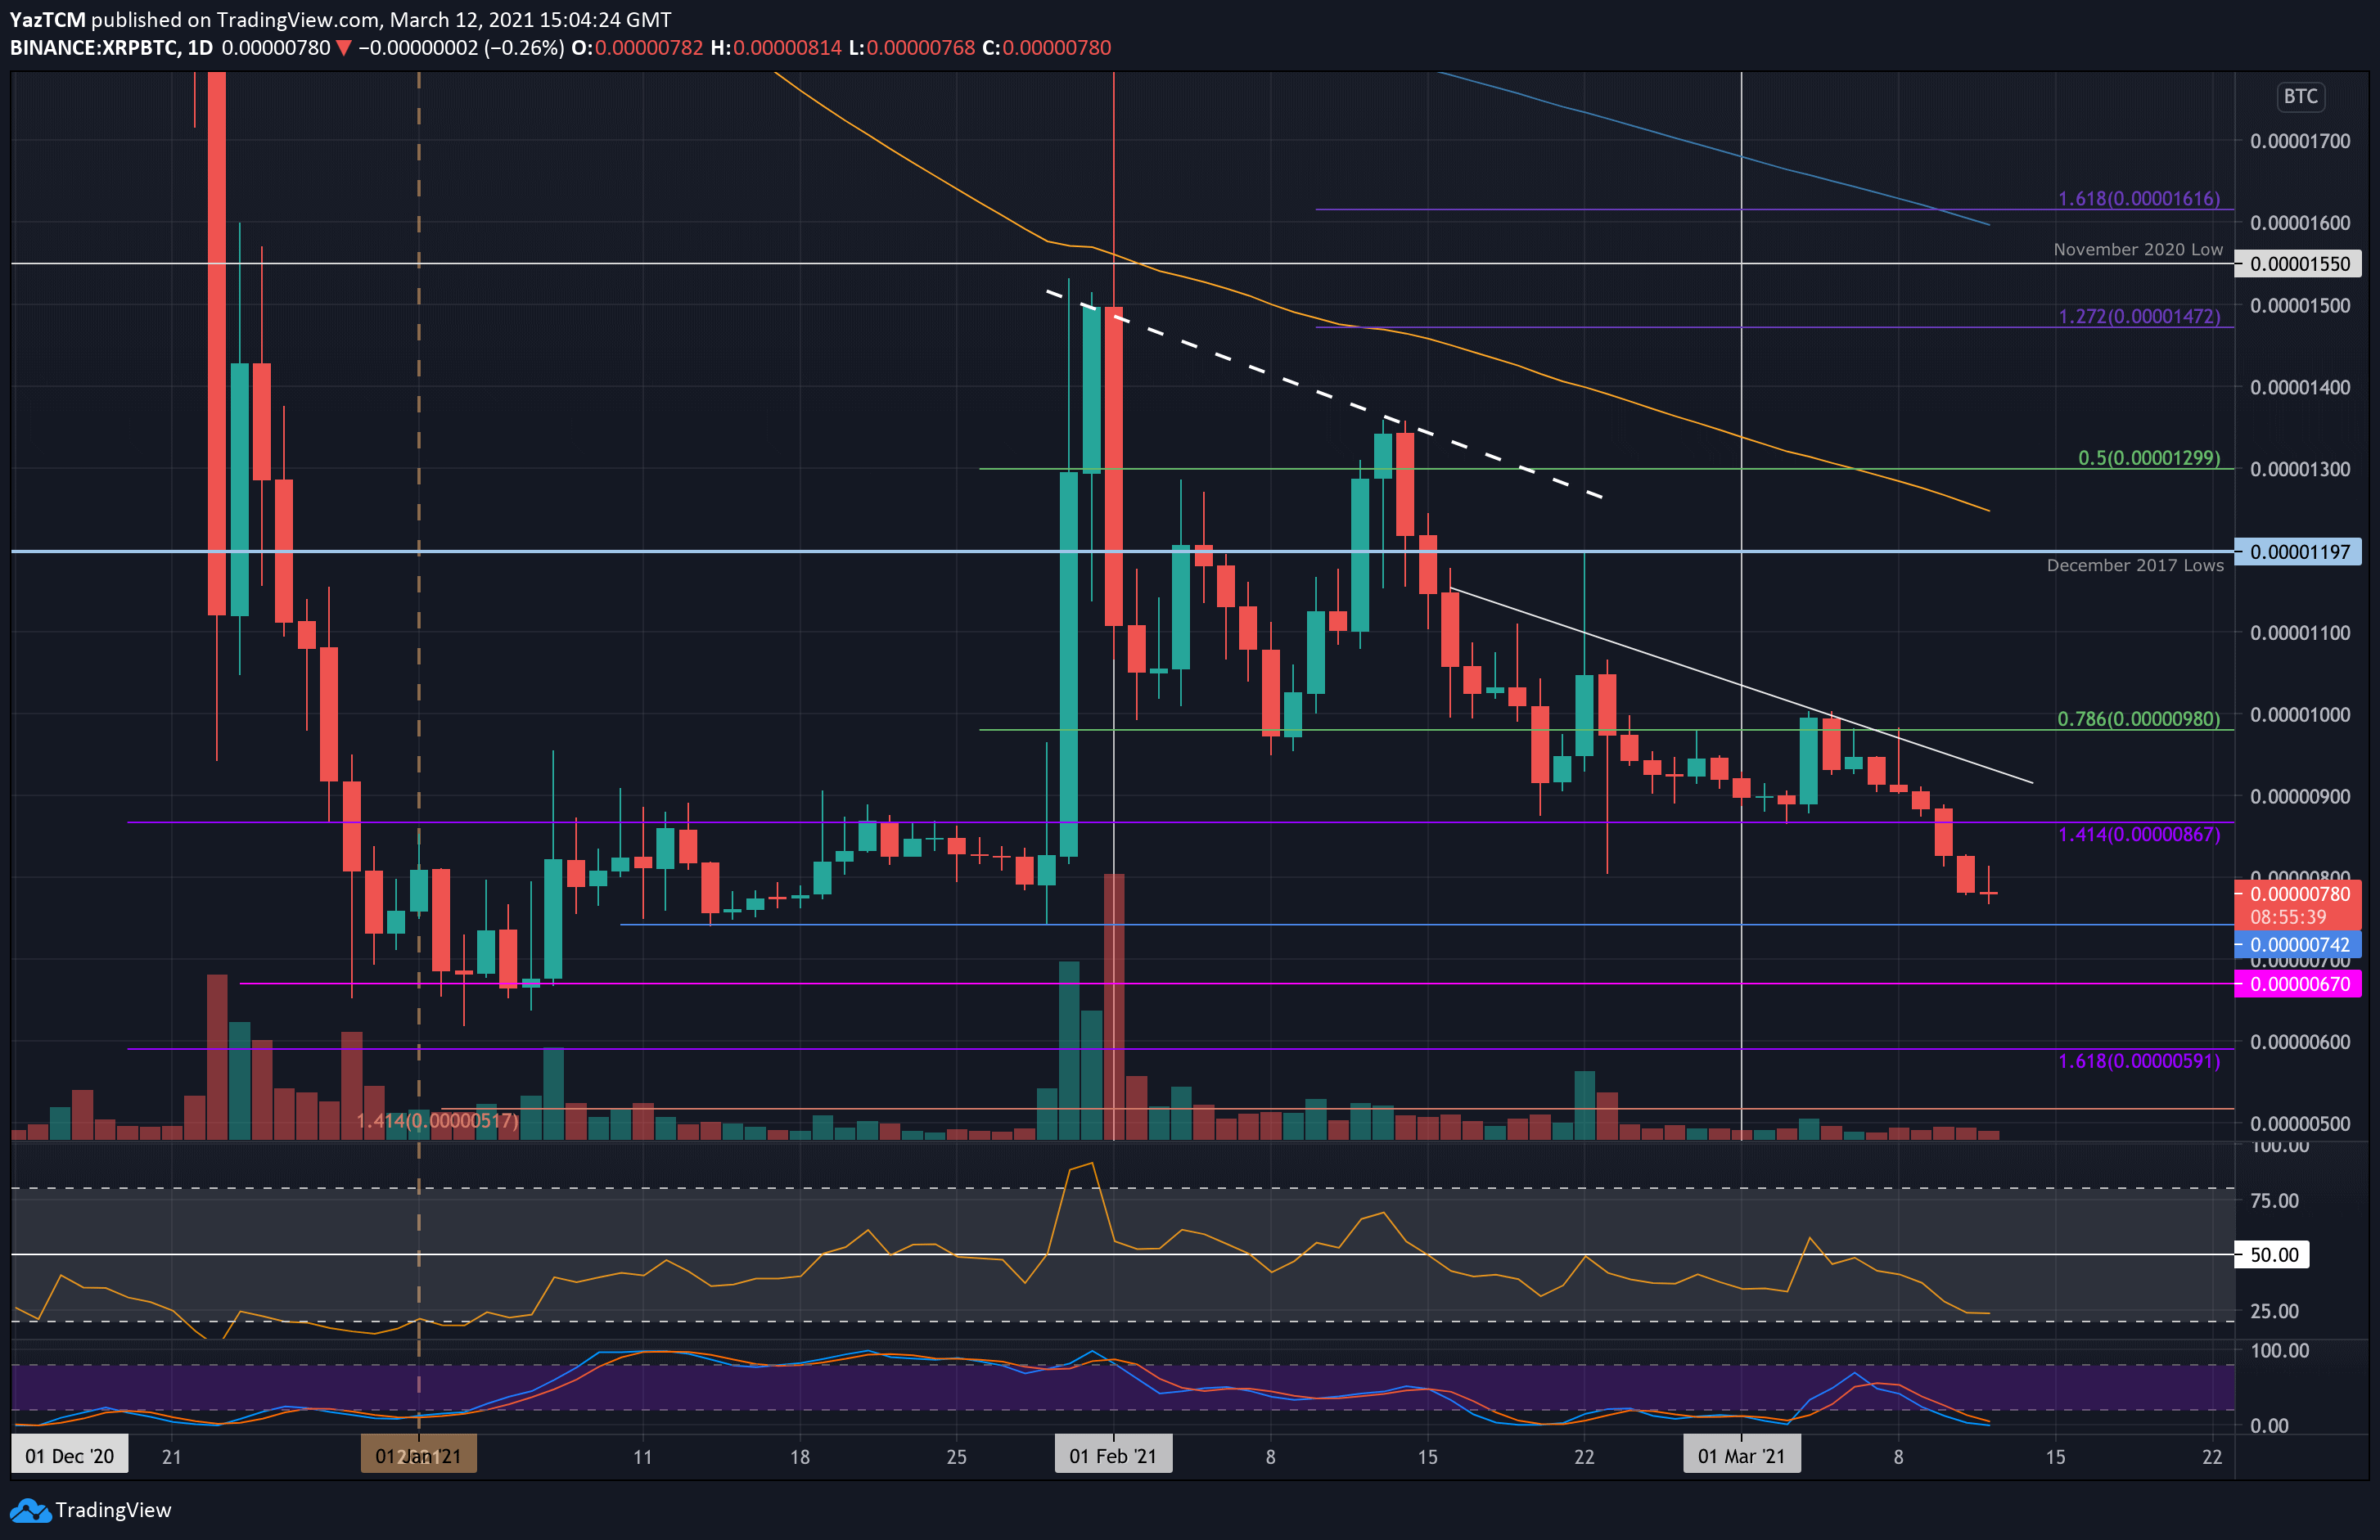
Against Bitcoin, XRP fell back into the trading range that it was in during January 2021 this week. The coin had started the week by trying to break above 1000 SAT. It could not achieve this and started to head lower from there.
On Wednesday, XRP fell beneath support at 867 SAT (the upper boundary of the January trading range). It continued further beneath 800 SAT yesterday to reach 780 SAT today.
Looking ahead, the first level of support now lies at 742 SAT. This is followed by support at 700 SAT, 670 SAT (lower boundary of January’s trading range), and 600 SAT.
On the other side, the first level of resistance lies at 867 SAT. This is followed by 900 SAT, 1000 SAT, and 1200 SAT (December 2017 lows).
Cardano
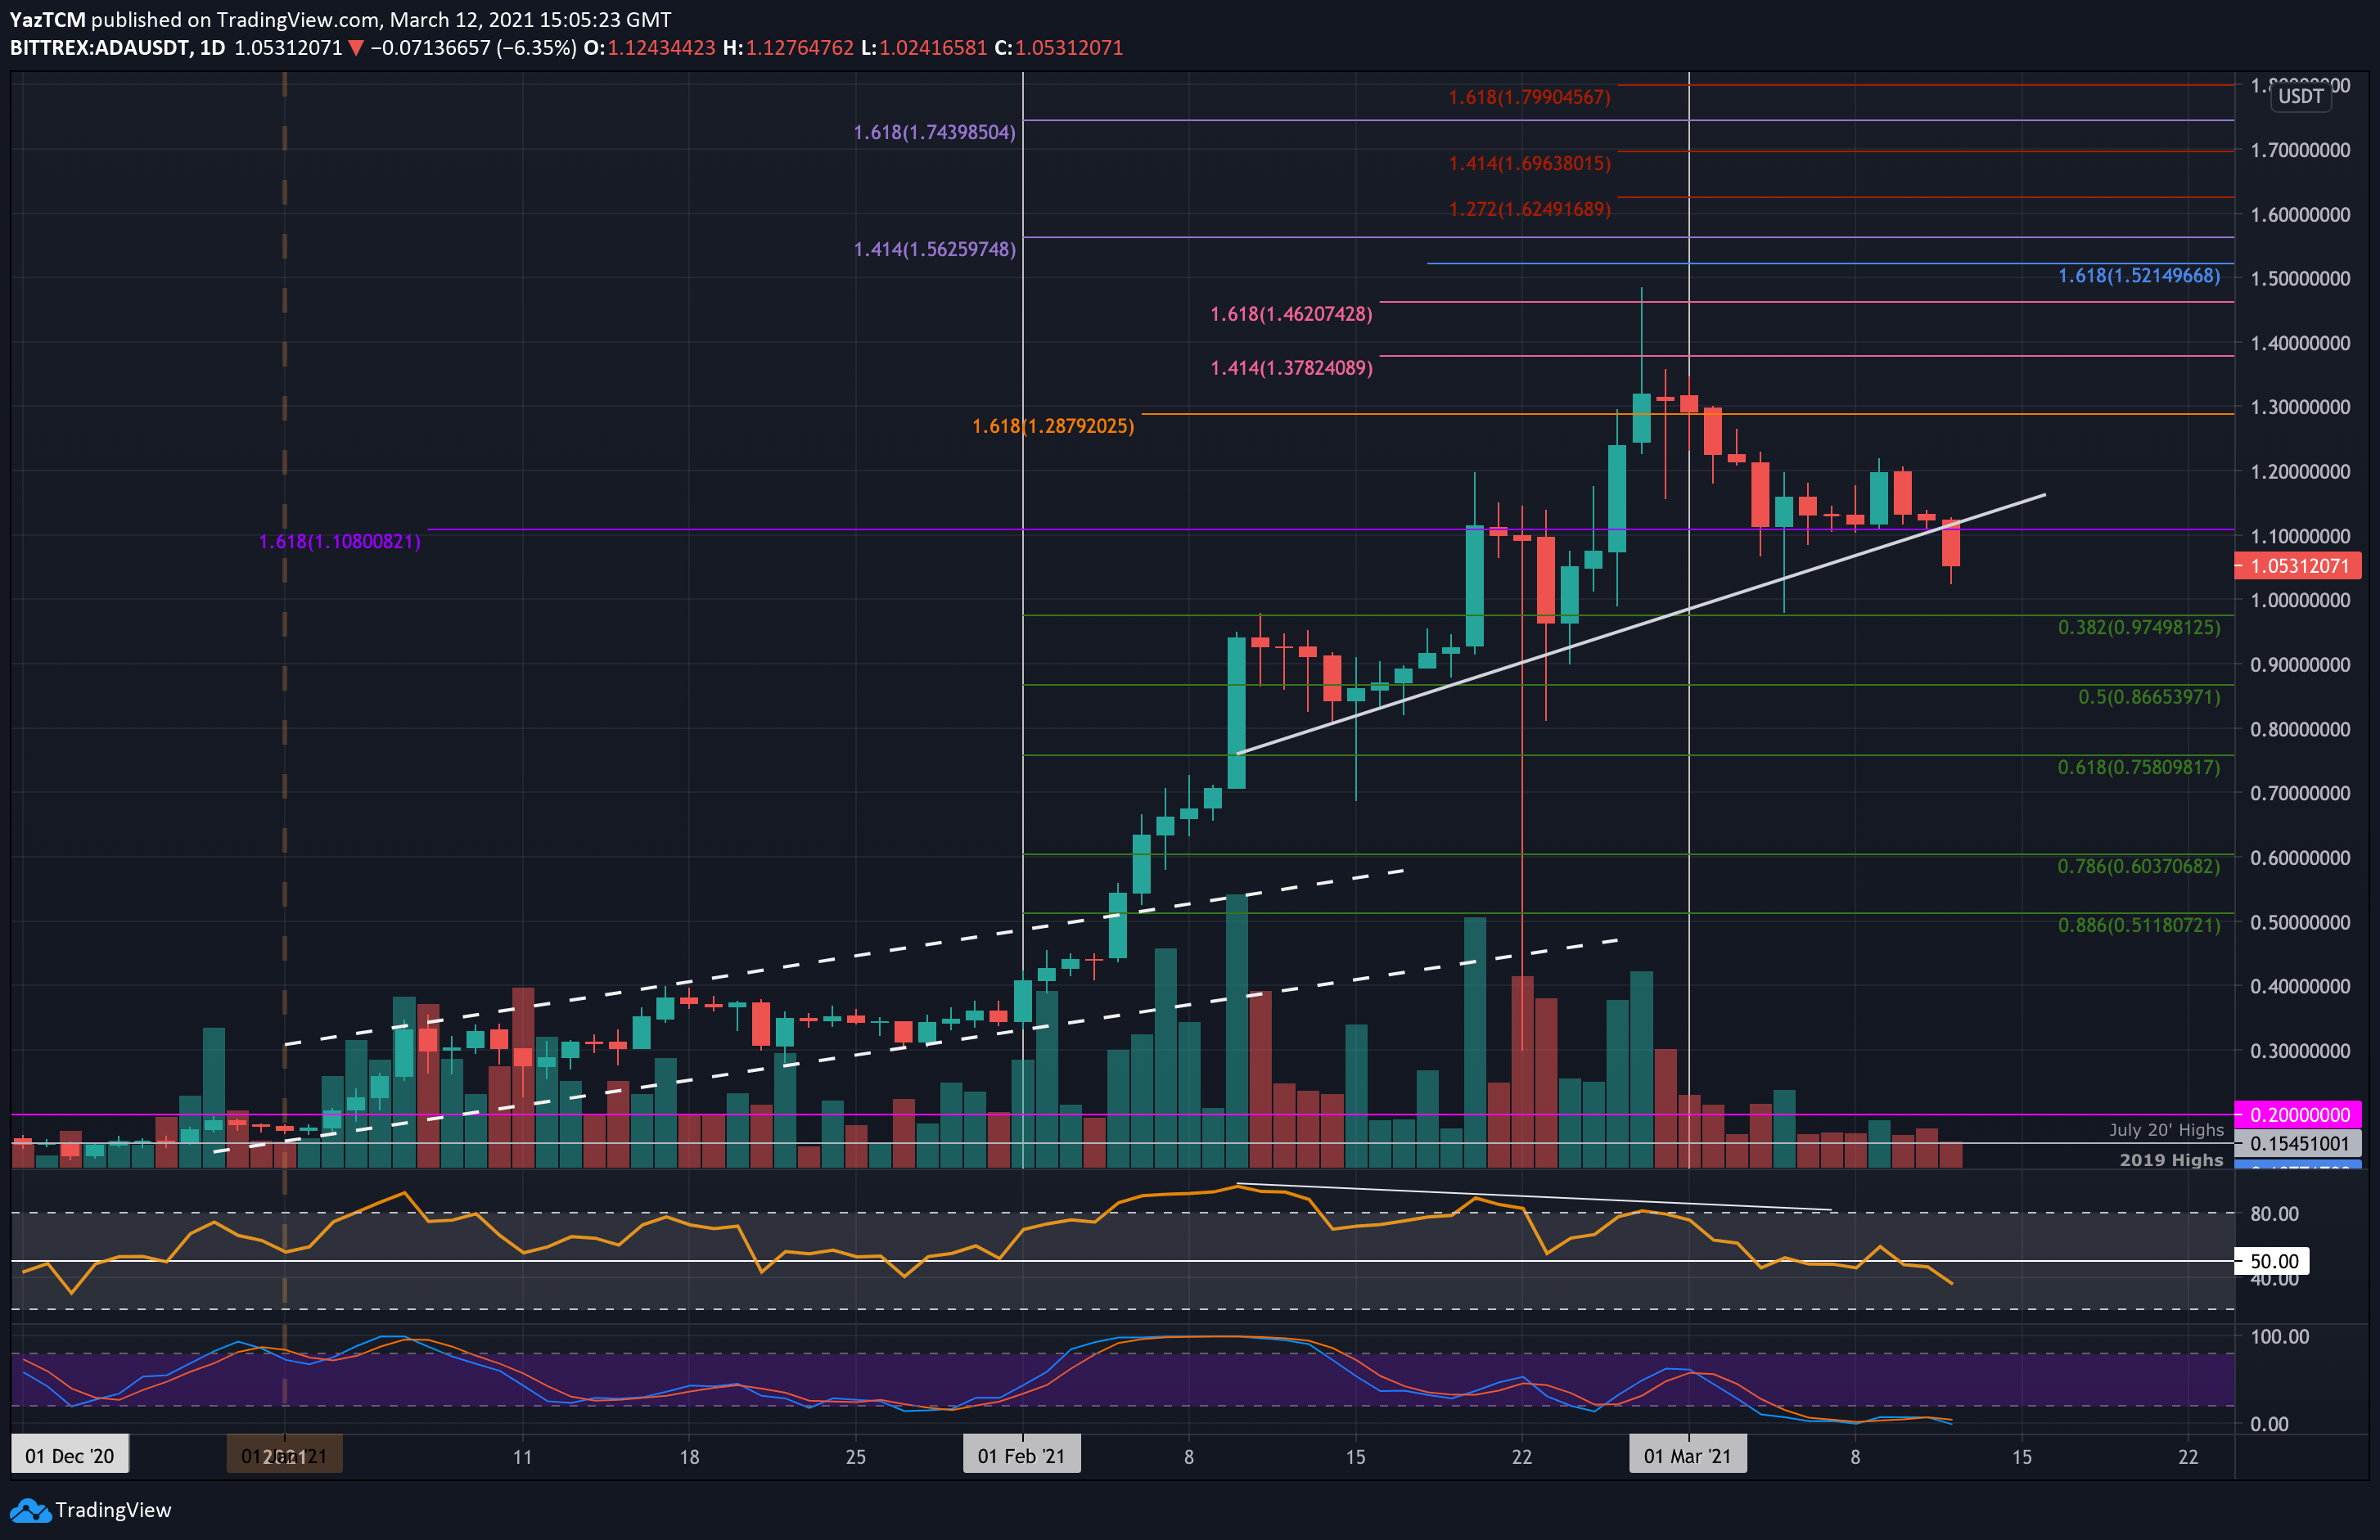
Cardano saw a small 4.5% decrease over the course of the week as it fell to $1.05 today. The cryptocurrency had started to decline at the beginning of March when it dropped from above $1.30 to reach support at $1.10.
It held at this support through the majority of the week but ended up collapsing beneath it today. In doing so, ADA also fell beneath a rising trend line that has been in play since mid-February.
Looking ahead, if the sellers continue to push lower, the first level of support lies at $1.00. This is followed by $0.975 (.382 Fib), $0.9, and $0.8665 (.5 Fib).
On the other side, the first level of resistance lies at $1.10. This is followed by $1.20, $1.30, and $1.40.
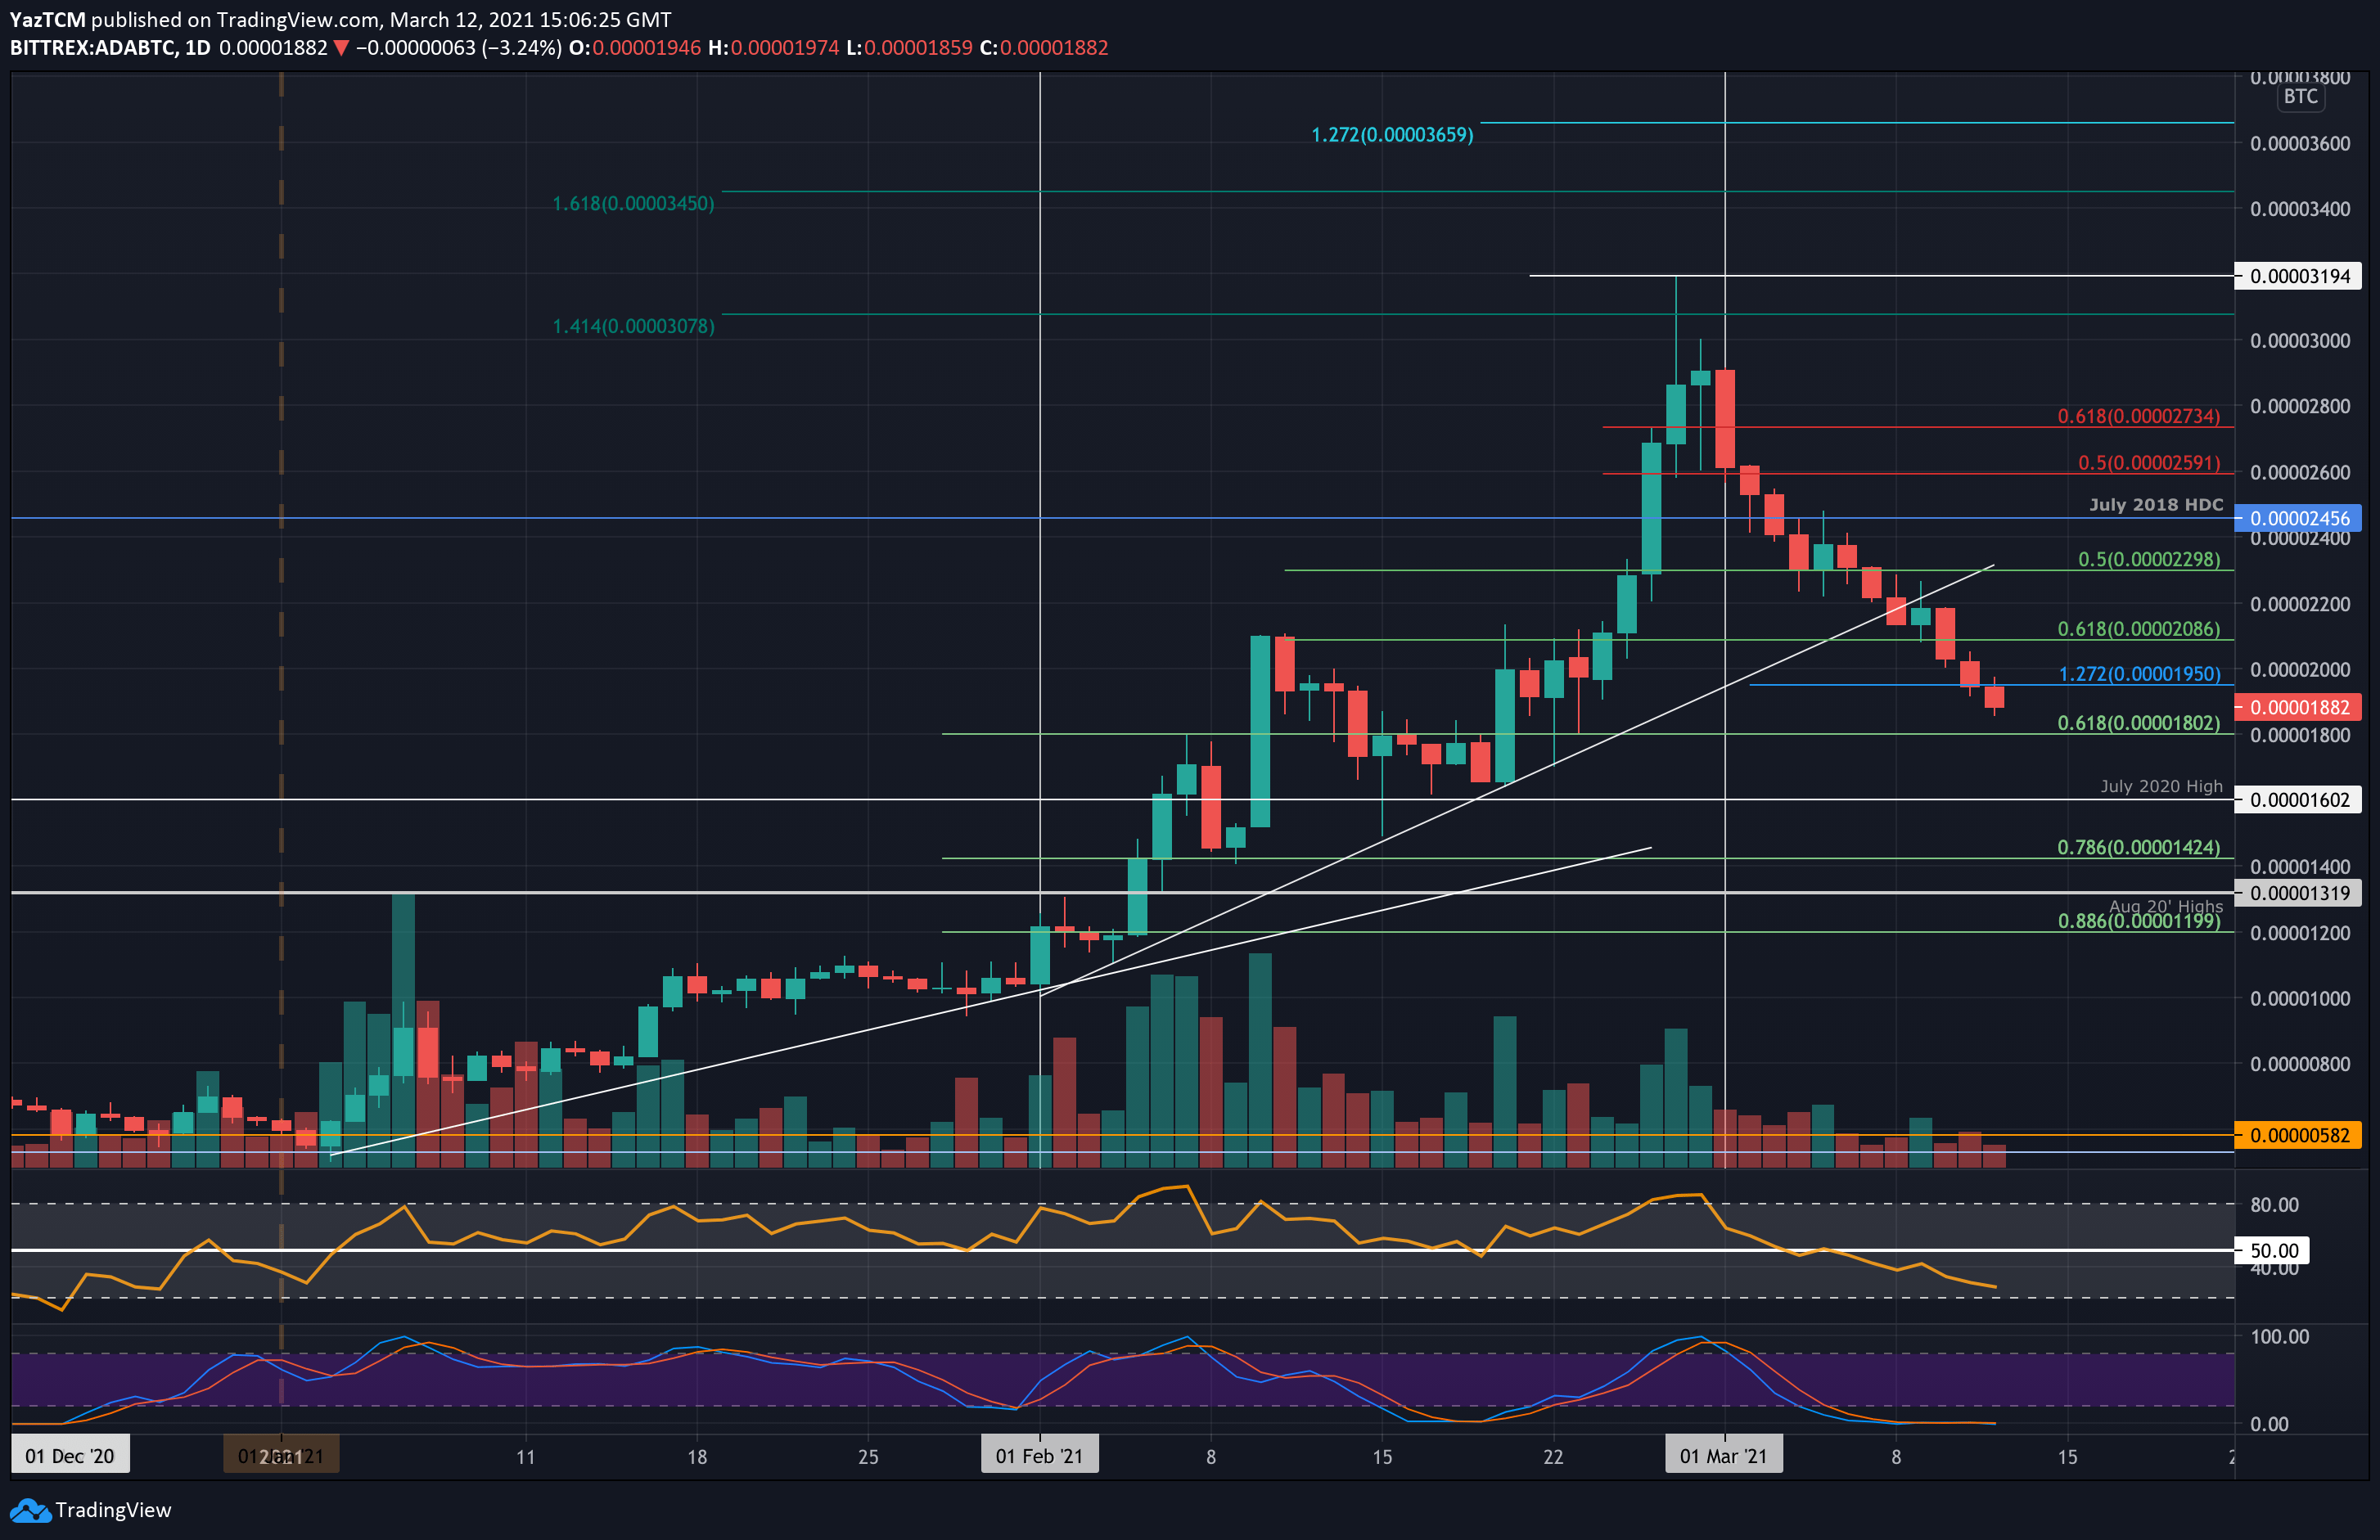
Against Bitcoin, ADA has also been falling quite significantly in March and so far has dropped by a total of 35% from the starting price of around 2900 SAT. It was trading above support at 2300 SAT (.5 Fib) at the start of the week but ended up slipping beneath it on Sunday.
Throughout the week, ADA broke beneath a rising trend line that was in play since the start of February and continued beneath the support at 2086 SAT (.618 Fib) on Wednesday. Yesterday, it dropped below 2000 SAT and reached the current 1882 SAT level.
Looking ahead, the first level of support lies at 1800 SAT (.618 Fib). This is followed by 1600 SAT (July 2020 Highs) and 1425 SAT (.786 Fib). Additional support lies at 1320 SAT (August 2020 highs).
On the other side, the first level of resistance lies at 1950 SAT. This is followed by 2000 SAT, 2200 SAT, and 2456 SAT (July 2018 High-Day close).
Litecoin
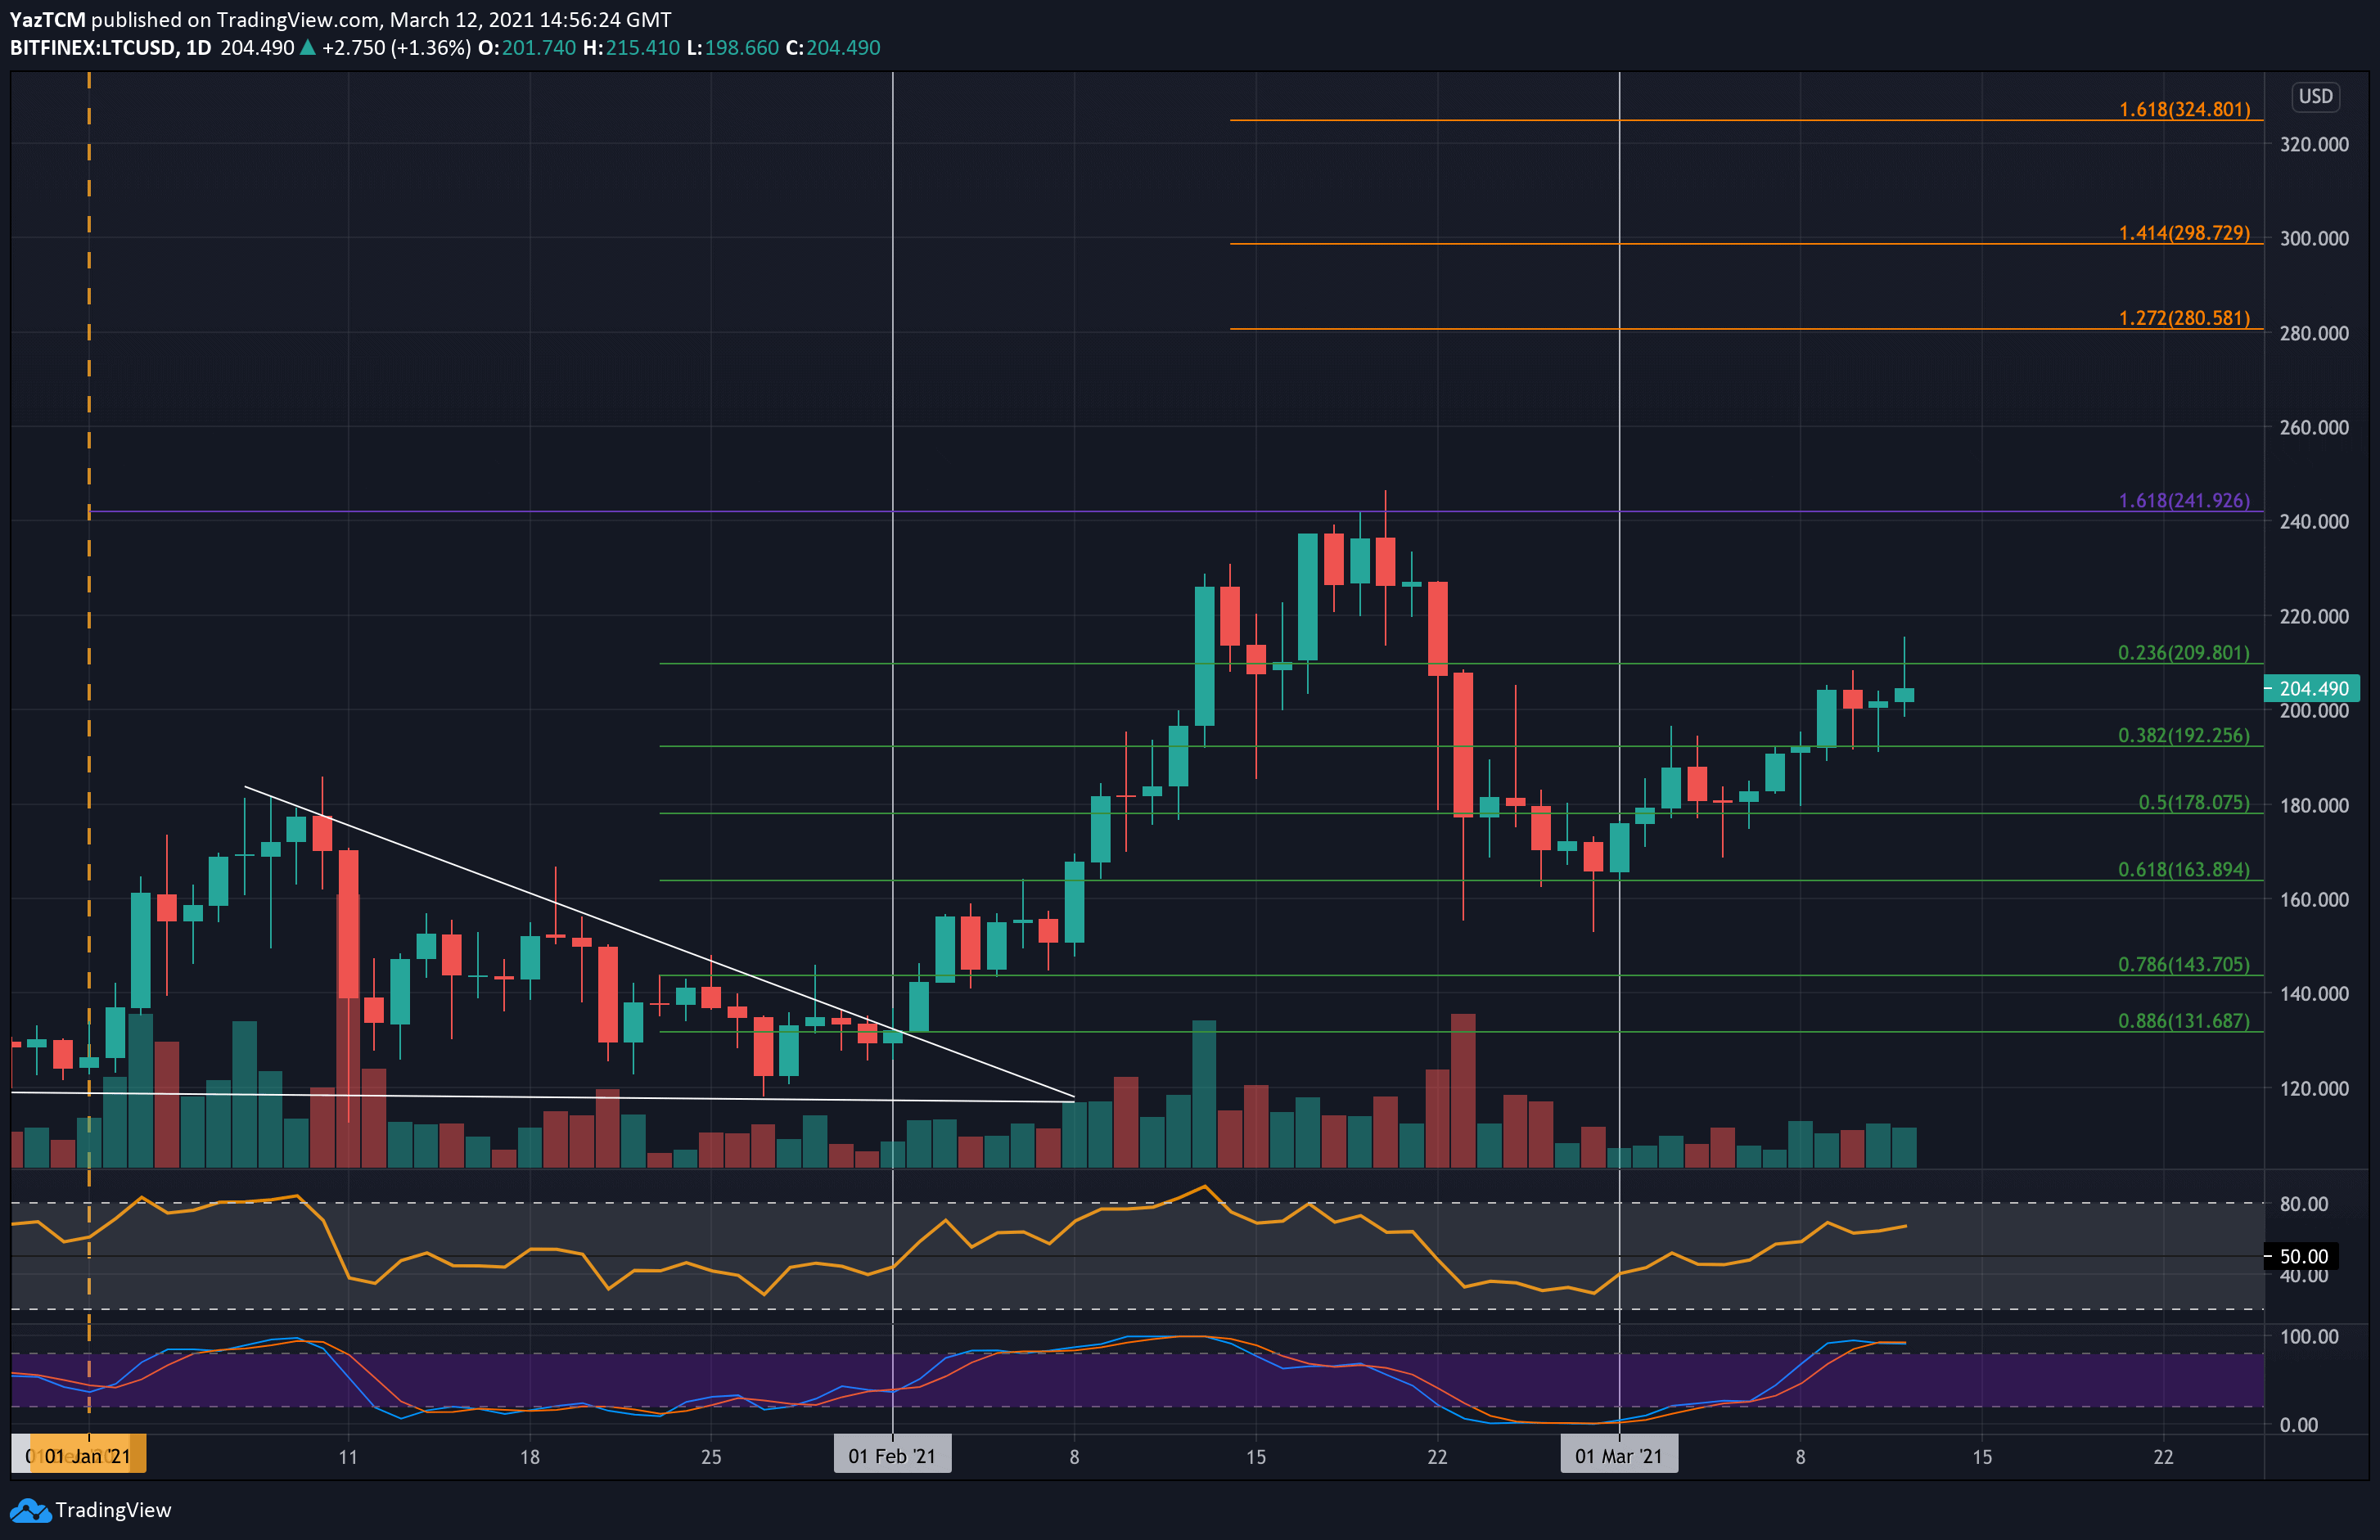
Litecoin witnessed a positive 14% price hike this week as it managed to break back above the $200 level again. The cryptocurrency had met resistance at $240 during February and rolled over from there to meet support at $164 (.618 Fib) by the end of the month.
This week, LTC bounced higher from $180 and began to surge until breaking $200 on Tuesday. It stalled at around $205 for the following few days until spiking above $210 today. It has since dropped lower again as it trades at $205.
Looking ahead, the first level of resistance lies at $210. This is followed by $220, $240 (February resistance), $260, and $280 (1.272 Fib Extension).
On the other side, the first level of support lies at $200. This is followed by $192 (.382 Fib), $178 (.5 Fib), and $164 (.618 Fib).
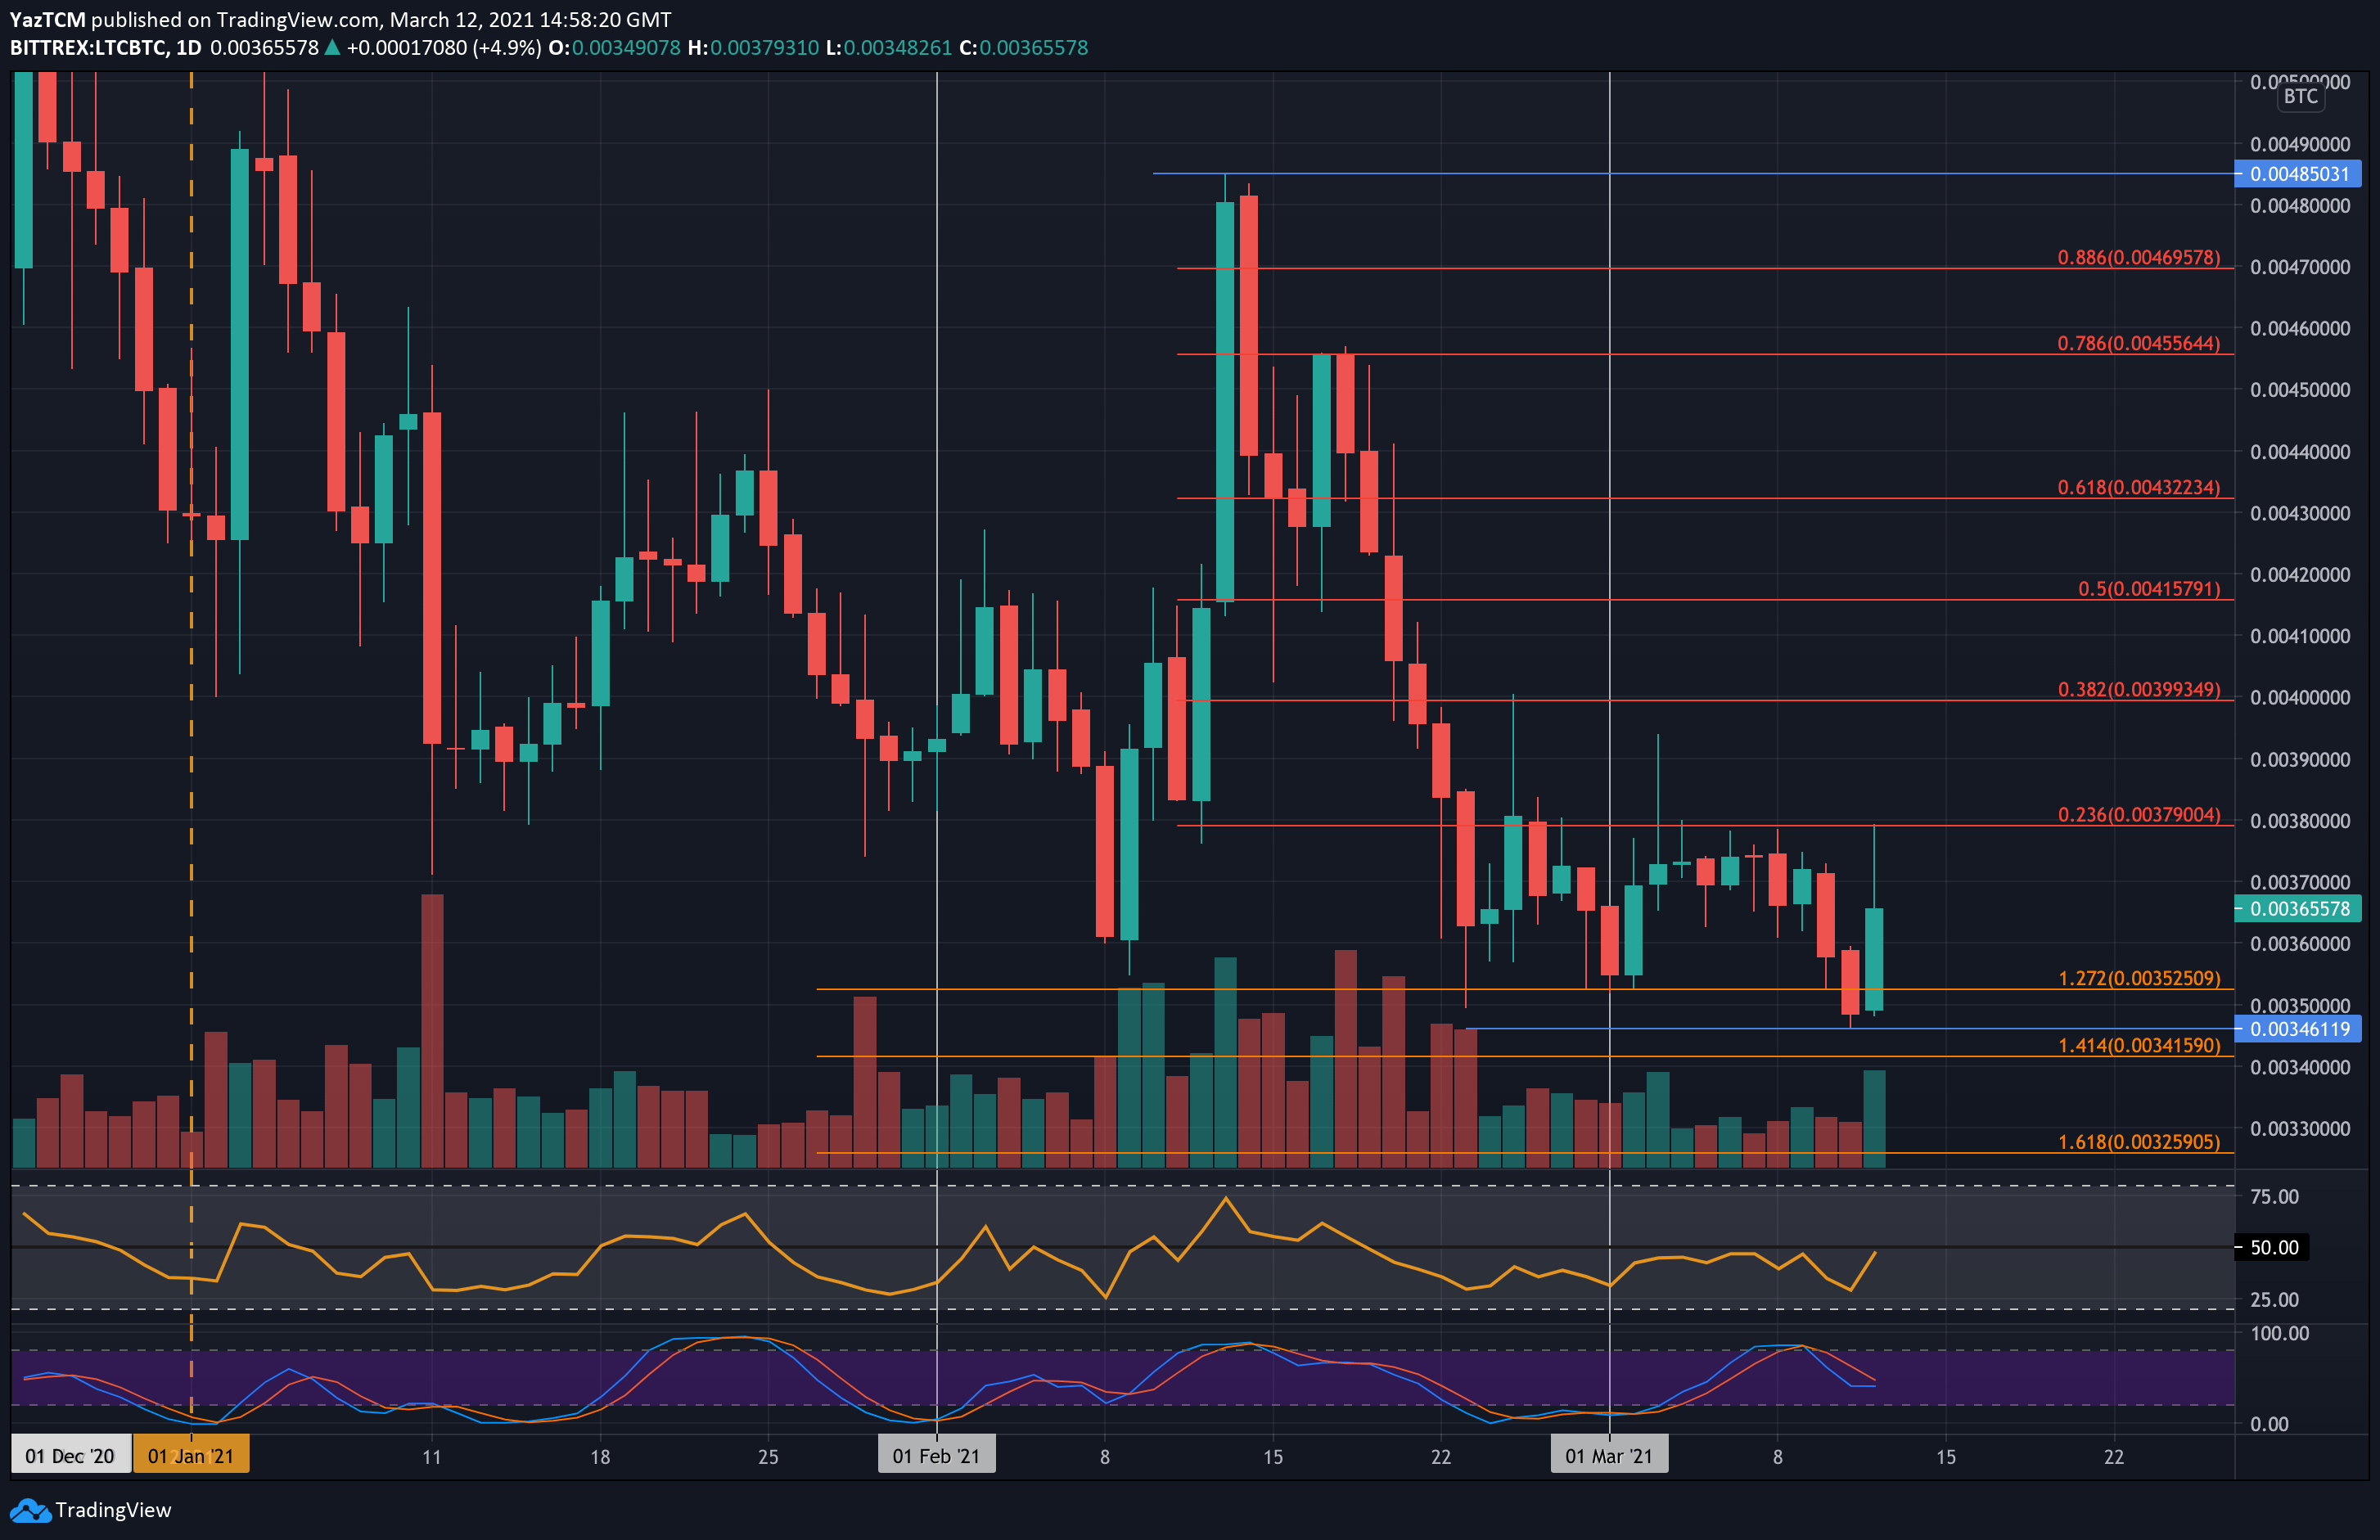
Litecoin has been suffering quite heavily over the past few weeks against Bitcoin. It had dropped from the February highs at 0.00485 BTC to reach as low as 0.00346 BTC yesterday.
Today, the bulls managed to rebound from the support at 0.00346 BTC as they pushed higher to reach the resistance at 0.00379 BTC (Bearish .236 Fib). This level has provided strong resistance throughout the entire period of March 2021 and must be penetrated for the market to recover.
Looking ahead, the first level of resistance lies at 0.0037 BTC. This is followed by 0.00379 BTC (bearish .236 Fib), 0.0039 BTC, and 0.004 BTC (bearish .382 Fib).
On the other side, the first level of support lies at 0.0036 BTC. This is followed by 0.00352 BTC, 0.00346 BTC, and 0.0034 BTC.