
Ethereum Price Analysis: ETH Bulls Run Into an Important Resistance at $1875, What’s Next?
ETH/USD – Bulls Run Into Resistance At $1875
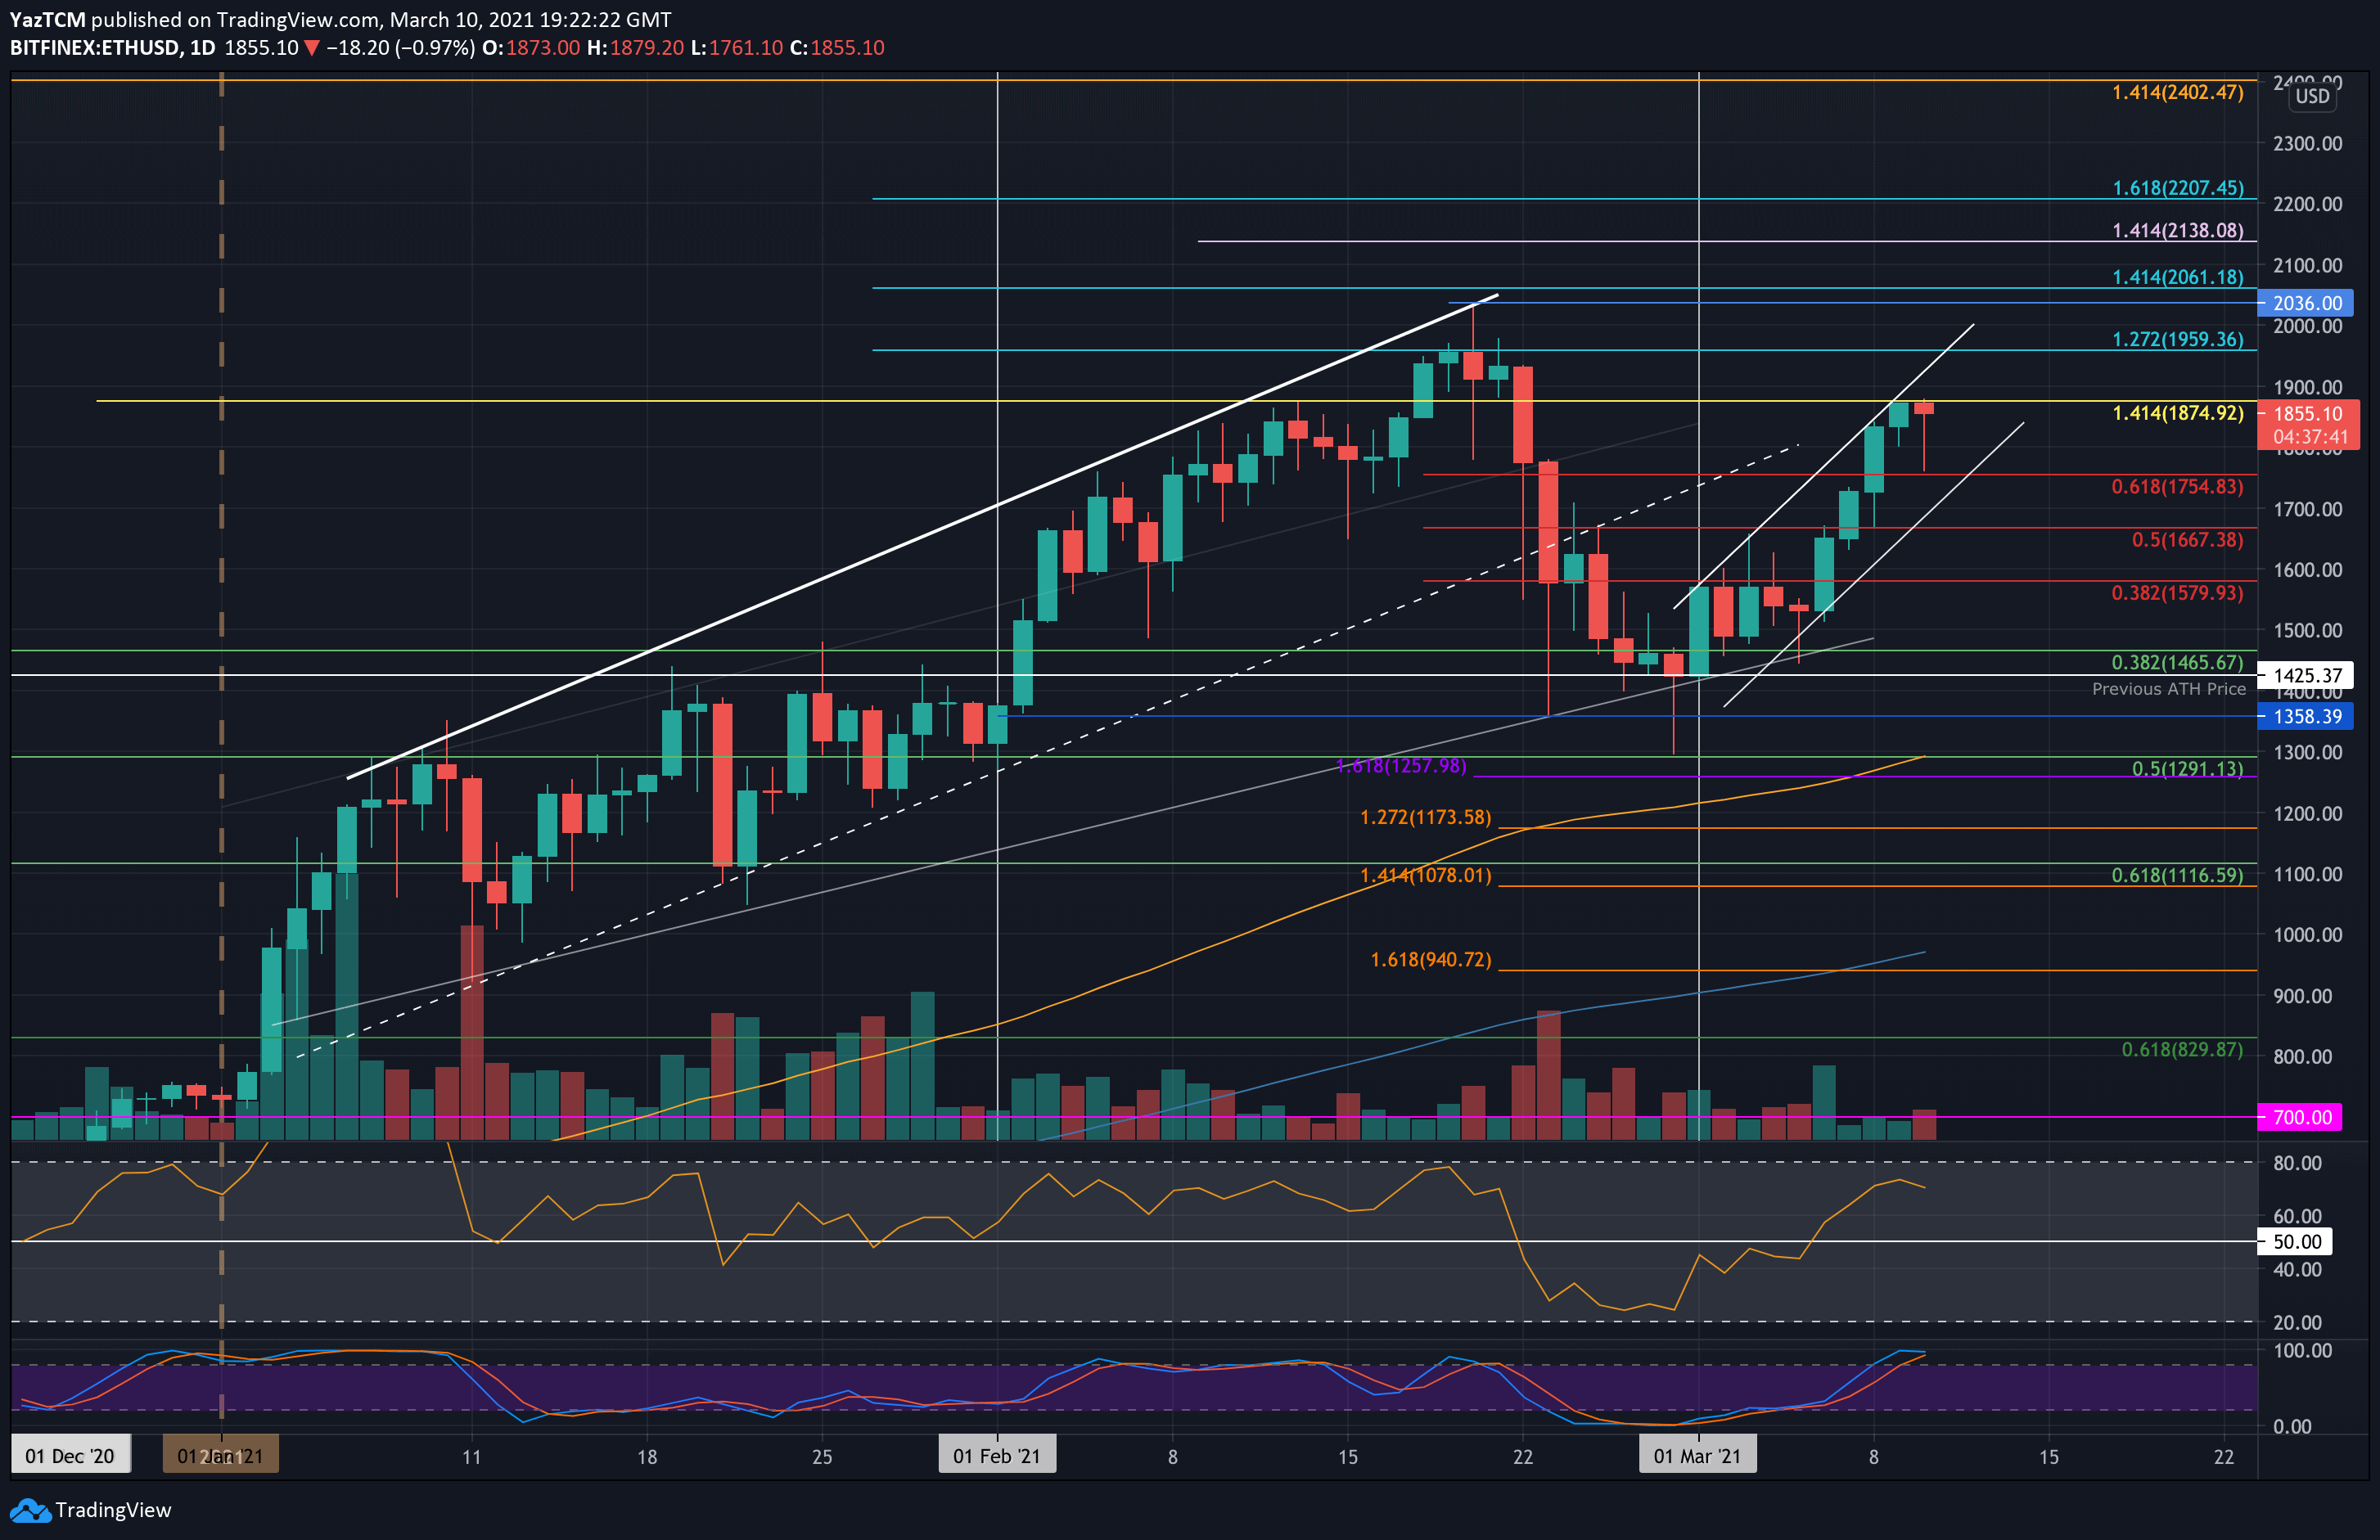
Key Support Levels: $1800, $1755, $1700.
Key Resistance Levels: $1875, $1900, $1960.
Ethereum has seen a strong bullish week as it is up by a total of 24% over the past seven days. At the start of March, the coin was struggling to break the resistance at $1580 (bearish .382 Fib). However, they finally poked above during the weekend.
The coin was rising every day this week until it hit the resistance at $1875 (1.414 Fib Extension – yellow) yesterday. Today, ETH dropped lower into $1755 earlier in the day but has since reversed and is now trading at $1855.
ETH-USD Short Term Price Prediction
Looking ahead, the first level of resistance lies at $1875. This is followed by $1900, $1960 (1.272 Fib Extension – blue), $2000, and $2036 (ATH price).
On the other side, the first level of support lies at $1800. This is followed by $1755, $1700, and $1667.
The RSI is in the bullish territory but is starting to point downward, indicating the bullish pressure might be starting to fade slightly. Additionally, the Stochastic RSI is looking overbought and is primed for a bearish crossover signal that would send the market lower.
ETH/BTC – Market Returns To 200-days EMA
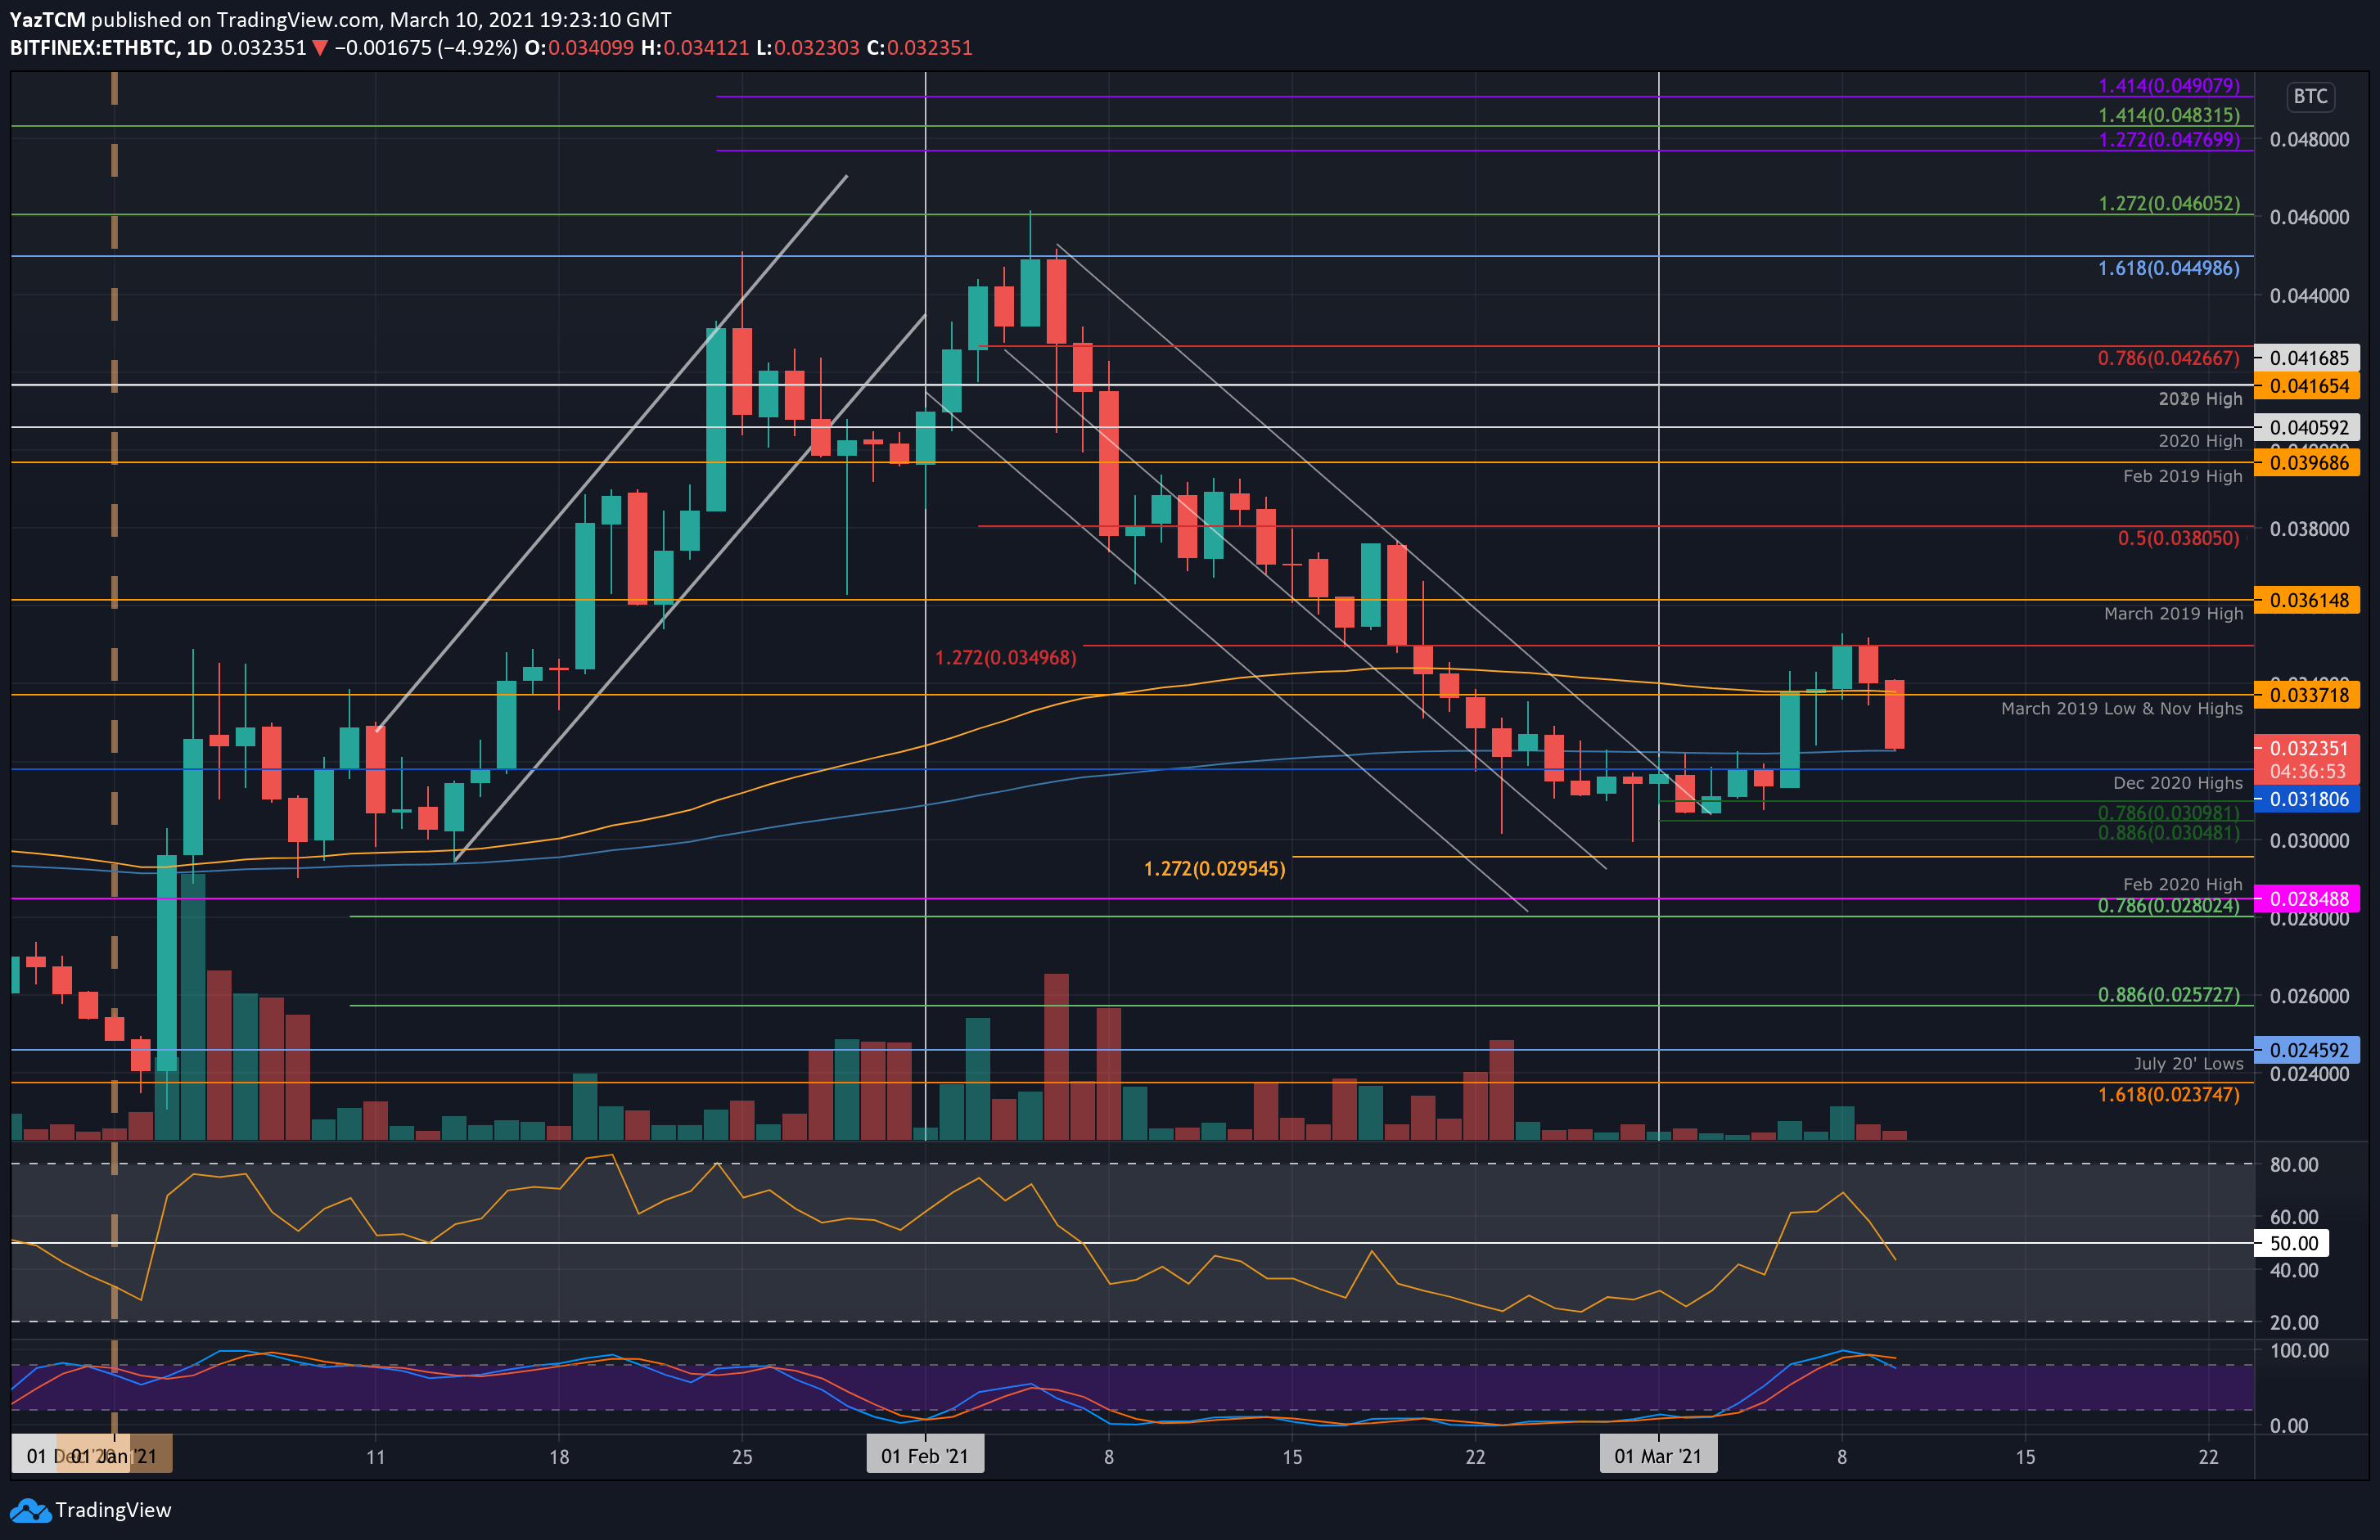
Key Support Levels: 0.031 BTC, 0.0309 BTC, 0.0304 BTC.
Key Resistance Levels: 0.0337 BTC, 0.035 BTC, 0.0361 BTC.
Against Bitcoin, Etheruem started the week on a bullish footing after it surged above the 200-day EMA on Saturday. During the first few days of the week, the coin went on to break past the 100-day EMA to reach the resistance at 0.035 BTC.
ETH rolled over from there yesterday and continued to drop beneath 0.0337 BTC (November 2020 highs) until hitting support at the 200-day EMA today, at around 0.0323 BTC.
ETH-BTC Short Term Price Prediction
Looking ahead, if the bulls can rebound from the 200-days EMA, the first level of resistance lies at 0.0337 BTC (Nov 2020 highs). This is followed by 0.035 BTC, 0.0361 BTC (March 2019 High), and 0.038 BTC (bearish .5 Fib).
On the other side, the first level of support lies at 0.031 BTC (December 2020 Highs). This is followed by 0.0309 BTC (short term .786 Fib), 0.0304 BTC (short term .886 Fib), and 0.03 BTC.
The RSI has dipped beneath the midline here, indicating the bears are now in control of the market momentum. If it continues to dip beneath 40, the bearish momentum will increase, and it is likely to push ETH beneath the December 2020 highs at 0.0318 BTC.


