
Ethereum Price Analysis: ETH Retesting All-Time High Levels at $3,500 Resistance
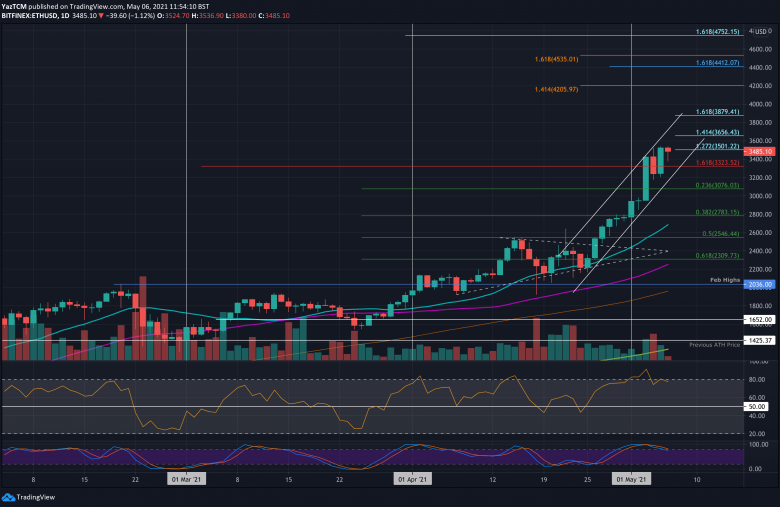
ETH/USD – 27% Weekly Price Hike Sees New ATH At $3542
Key Support Levels: $3400, $3200, $3076.
Key Resistance Levels: $3542, $3656, $3800.
Ether is up by a total of 27% this week and it set a new ATH price at $3542 yesterday. It headed lower slightly today but rebounded from the support at $3400 to trade at $3485.
ETH is now in a steep ascending price channel since breaking out of a symmetrical triangle pattern in the last few days of April. In May, ether broke above $2800 and continued higher above $3000 on Monday – reaching $3400. On Tuesday, it dropped to $3200 but rebounded from there yesterday to set the new ATH price.
The $3,500 level forms a notable resistance – it was tested a few times in the past few days and it’s important for the price to overcome it definitively to continue higher.
ETH-USD Short Term Price Prediction
Looking ahead, the first resistance lies at the ATH price of $3542. This is followed by $3656 (1.414 Fib Extension), $3800, $3880 (1.618 Fib Extension), and $4000.
On the other side, the first support lies at $3400. This is followed by $3200 (lower boundary of the current channel), $3076 (.236 Fib), and $3000.
The RSI dropped slightly since Monday’s push higher and is showing bearish divergence. Nevertheless, the bulls are still in complete control of the market momentum right now.
ETH/BTC – Bulls Reach As High As 0.0632 BTC.
Key Support Levels: 0.06 BTC, 0.0563 BTC, 0.0541 BTC.
Key Resistance Levels: 0.0611 BTC, 0.0632 BTC, 0.0656 BTC.
Ethereum continues to perform well against bitcoin after surging as high as 0.0632 BTC (1.618 Fib Extension) on Tuesday. The cryptocurrency had pushed higher from 0.0522 BTC on Monday to break above the April 2018 lows and reach 0.06 BTC. It then went on to set the new 2021 high at 0.0632 BTC on Tuesday.
It has since dropped slightly, but the bulls are battling to hold the support at 0.06 BTC.
ETH-BTC Short Term Price Prediction
Looking ahead, if the bulls rebound from 0.06 BTC, the first resistance lies at 0.0611 BTC. This is followed by 0.0632 BTC (1.618 Fib Extension – orange), 0.0656 BTC (1.618 Fib Extension – purple), 0.0676 BTC (1.272 Fib Extension – blue), and 0.07 BTC.
On the other side, if the bears break 0.06 BTC, the first support lies at 0.0563 BTC (.236 Fib). This is followed by 0.0541 BTC (April 2018 low), 0.0522 BTC (.382 Fib), and 0.05 BTC.
The RSI is also in the bull’s favor and has dropped slightly from extremely overbought conditions. This should give the buyers breathing room before starting to push higher again.


