Ripple Price Analysis: XRP Slides Back to $0.65 After Failing to Break Out
XRP/USD – XRP Stalled By June Downward Sloping Trendline
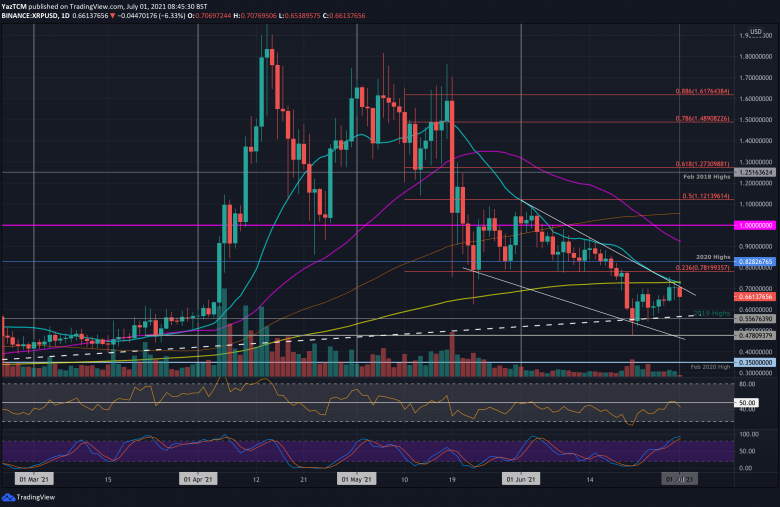
- Key Support Levels: $0.6, $0.556, $0.5.
- Key Resistance Levels: $0.7, $0.781, $0.8282.
XRP looked promising last week after bouncing off the 2019 highs around $0.55 and heading higher. It went on to break $0.6 and pushed higher to meet the resistance at $0.7. The support there was further bolstered by the lower boundary of the falling wedge currently trading within.
Unfortunately, XRP was unable to close a daily candle above $0.7. The resistance here is provided by a combination of the upper boundary of the wedge, the 200-day MA, and the 20-day MA).
It has since rolled over from the wedge’s boundary and dropped to $0.66.

XRP/USD Daily Chart. Source: TradingView.
XRP-USD Short Term Price Prediction
Looking ahead, if the sellers continue to drive XRP lower, the first support lies at $0.6. This is followed by $0.556 (2019 highs), $0.5, and $0.478.
On the other side, the first resistance lies at $0.7 (wedge upper boundary & 200-day MA). Additional resistance lies at $0.781 (bearish .236 Fib), $0.8282 (2020 highs), and $0.91 (50-day MA).
The RSI attempted to turn bullish after hitting the midline. Unfortunately, the bulls failed to establish any momentum, and the RSI has since dropped back beneath the midline, indicating the sellers are still unwilling to relinquish control.
XRP/BTC – Bulls Fail To Break 2000 SAT.
Key Support Levels: 1900 SAT, 1800 SAT, 1660 SAT.
Key Resistance Levels: 2000 SAT, 2120 SAT, 2250 SAT.
XRP was also performing well against BTC this week after breaking the June downward sloping trendline on Tuesday. Before this, XRP created a fresh 3-month low at 1660 SAT as it fell into the 200-day MA.
After pushing above the trendline, XRP surged higher to hit resistance at the 20-day MA. Unfortunately, it could not close a daily candle above 2000 SAT and failed to break the 20-day MA. It has since dropped to 1970 SAT.
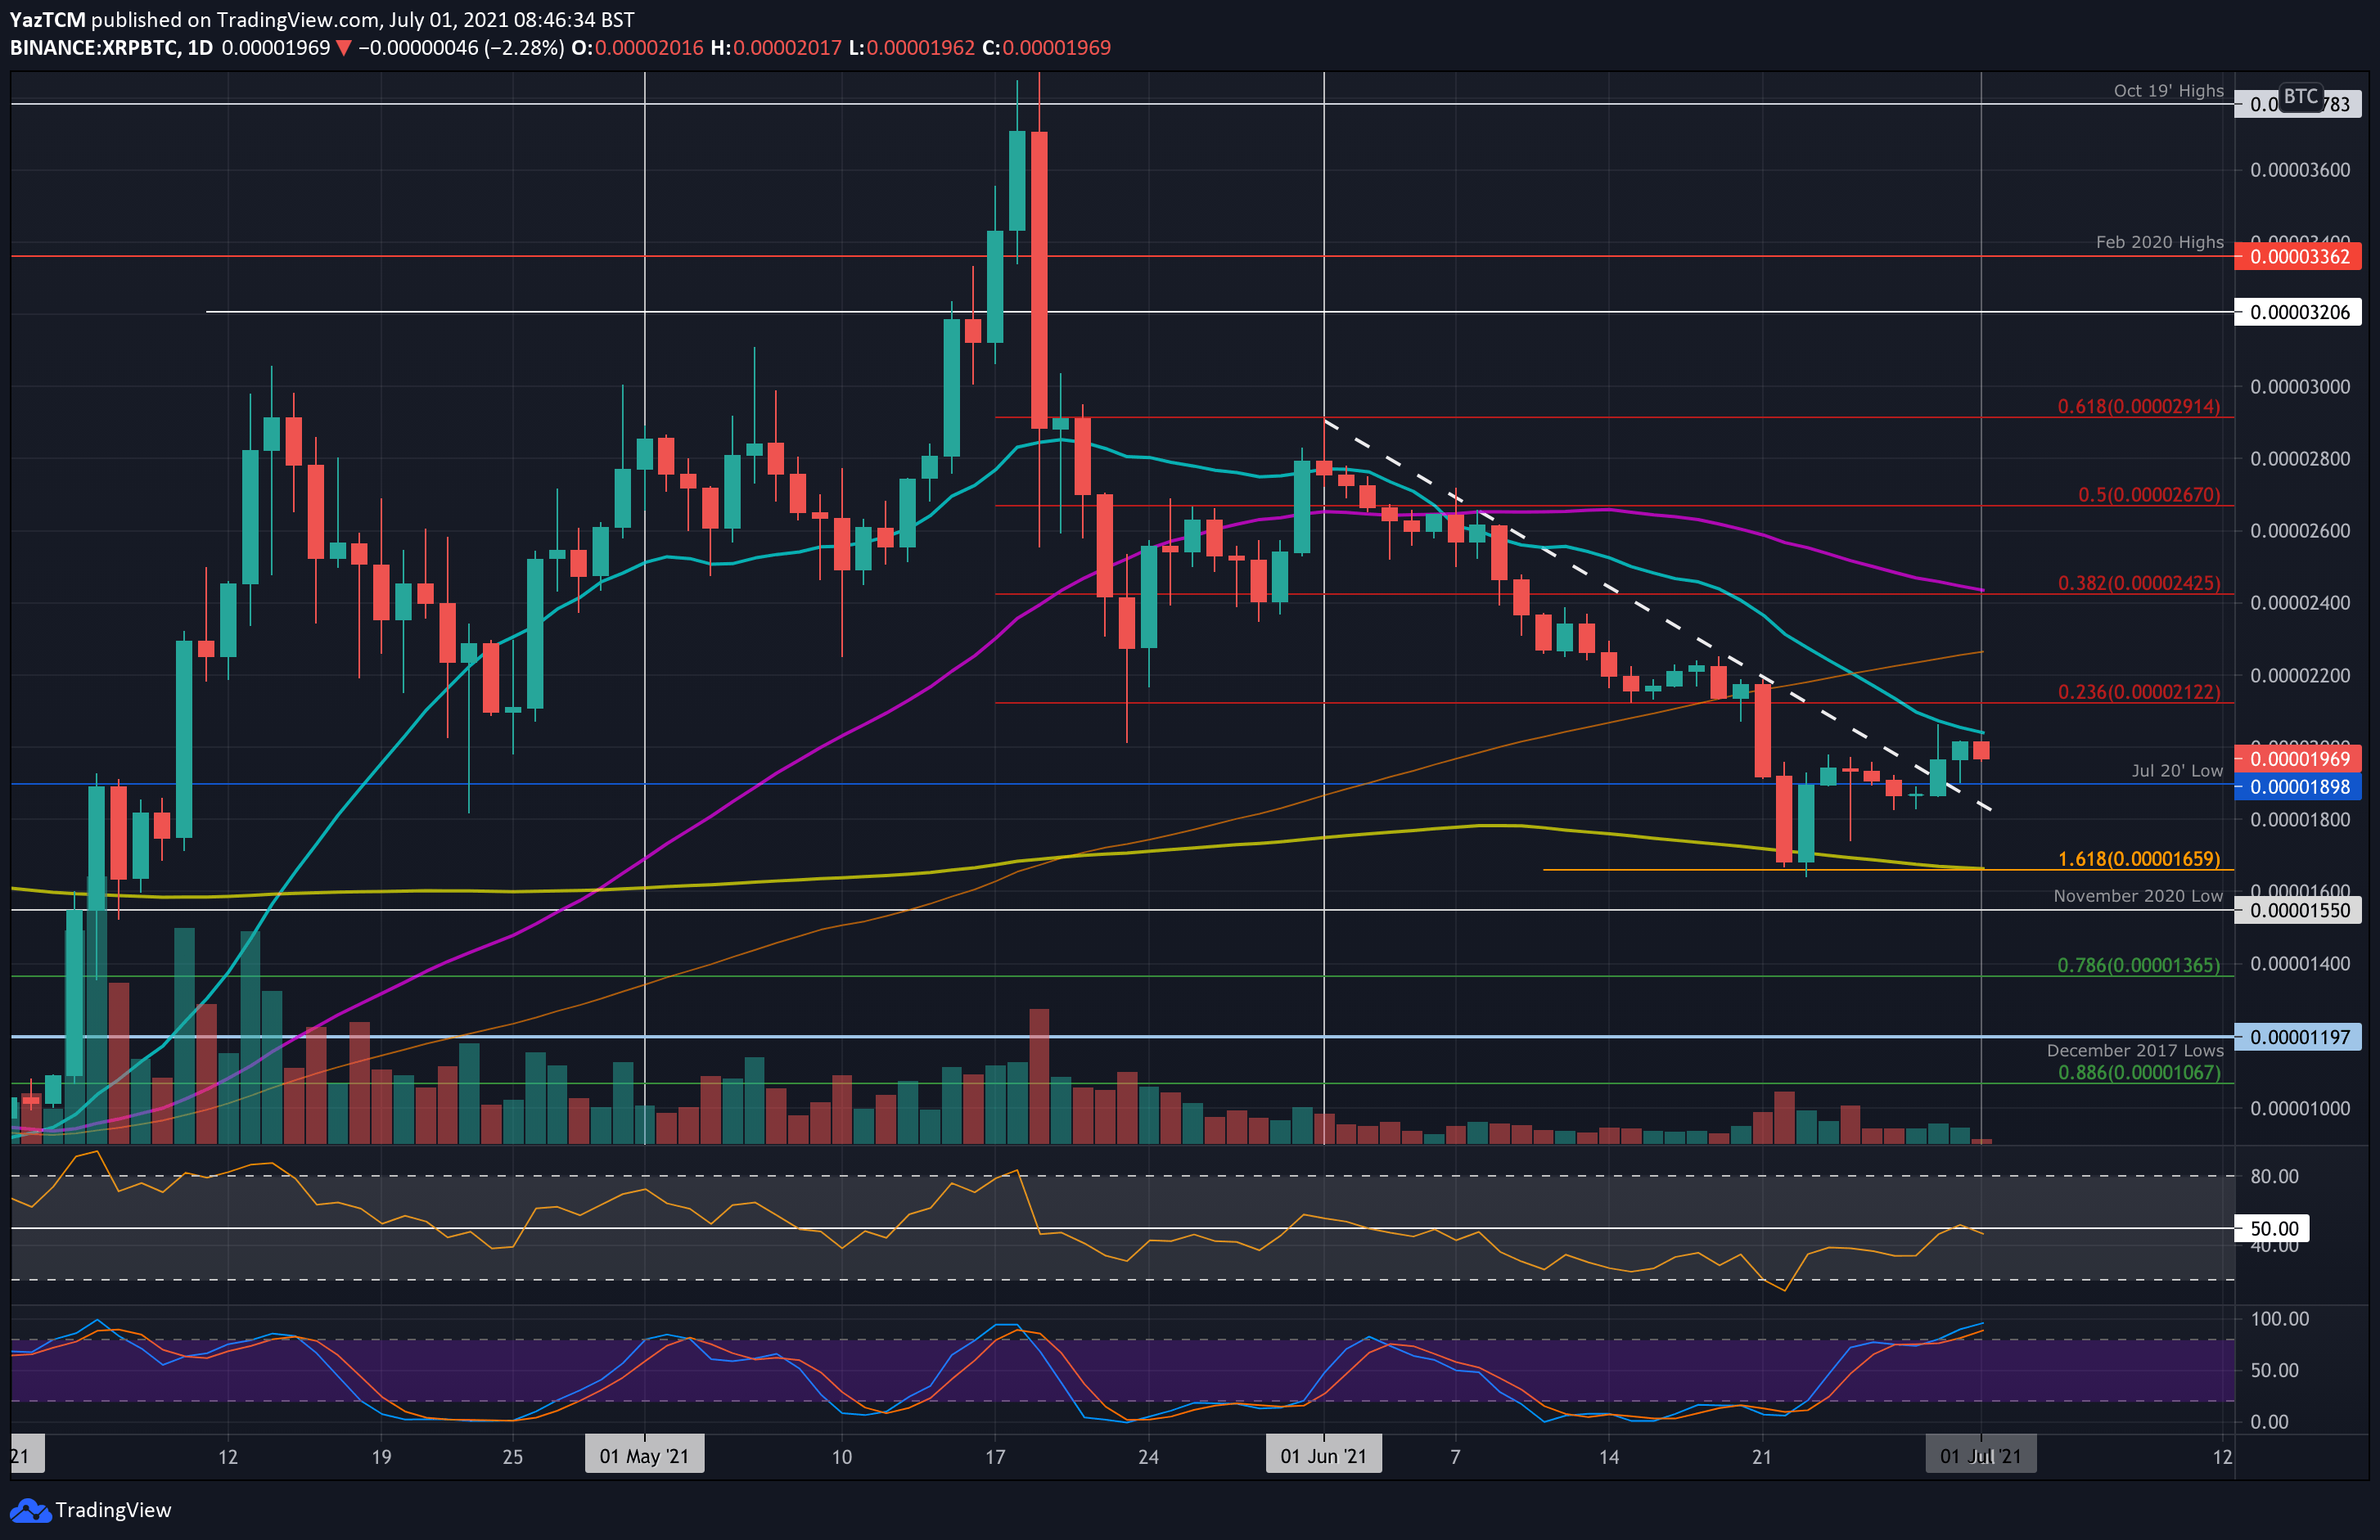
XRP/BTC Daily Chart. Source: TradingView.
XRP-BTC Short Term Price Prediction
Looking ahead, the first support to the downside lies at 1900 SAT (Jul 2020 low). This is followed by 1800 SAT, 1660 SAT (downside 1.618 Fib Extension & 200-day MA), and 1550 SAT (November 2020 lows).
On the other side, the first resistance lies at 2000 SAT (20-day MA). This is followed by 2120 SAT (bearish .236 Fib), 2250 SAT (100-day MA), and 2425 SAT (bearish .382 Fib & 50-day MA).
Likewise, the bulls failed to establish any momentum as the RSI reversed after hitting neutral territory. It seems that the bearish momentum might start to increase over the coming days.