Signs of Whale Accumulation, but Where is Bitcoin Potentially Heading if $30K Breaks? (BTC Price Analysis)
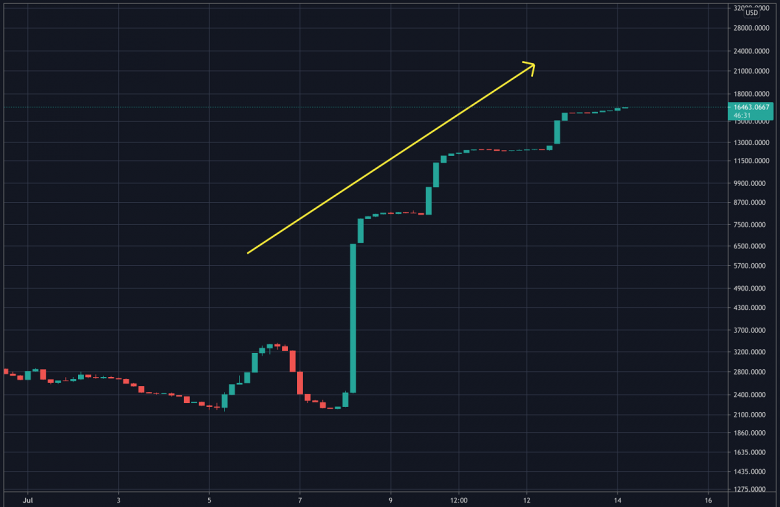
BTC started the week with a 7% pullback, a jump in BTC Bitfinex Shorts, and uncertainty over Grayscale’s GBTC unlock. On-chain analysis detected Net Exchange Inflows and increasing Bitfinex Shorts before BTC started its latest price dump, as can be seen on the following charts:
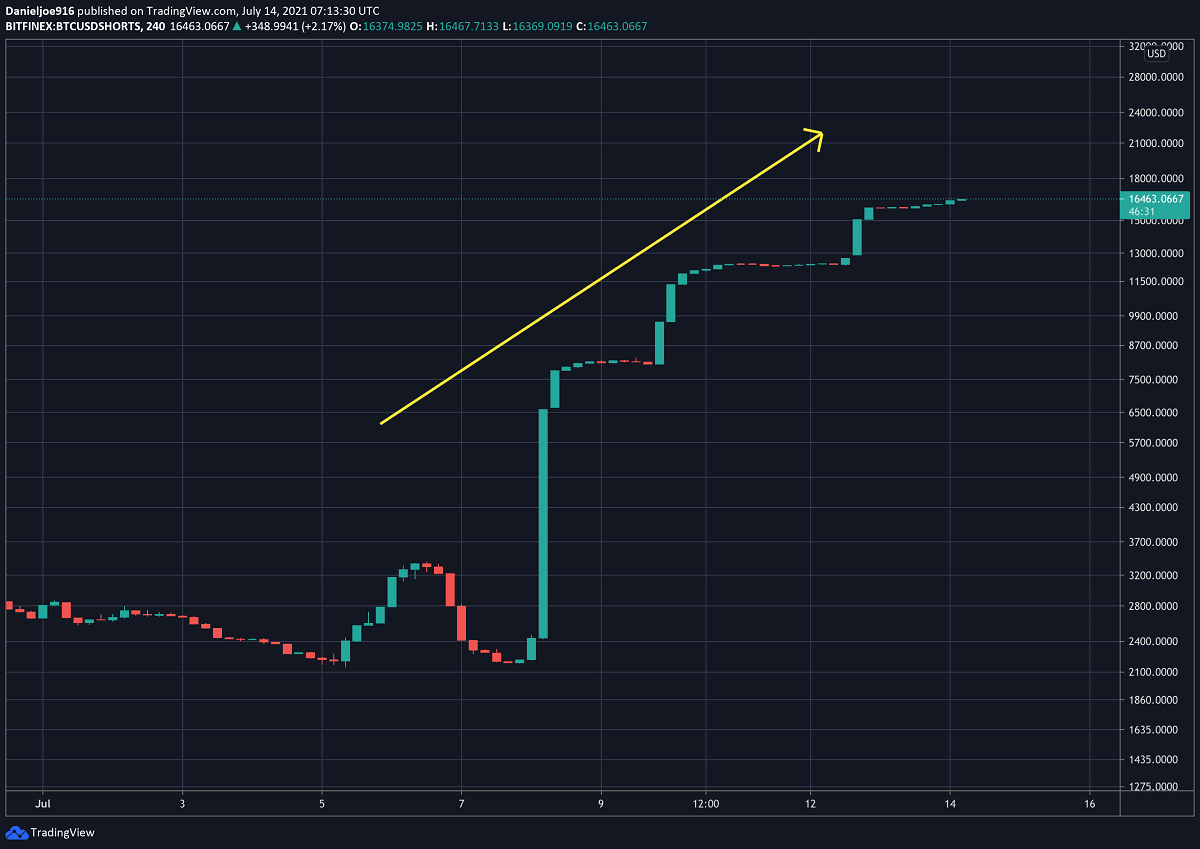
BitFinex shorts accumulating before the recent BTC crash
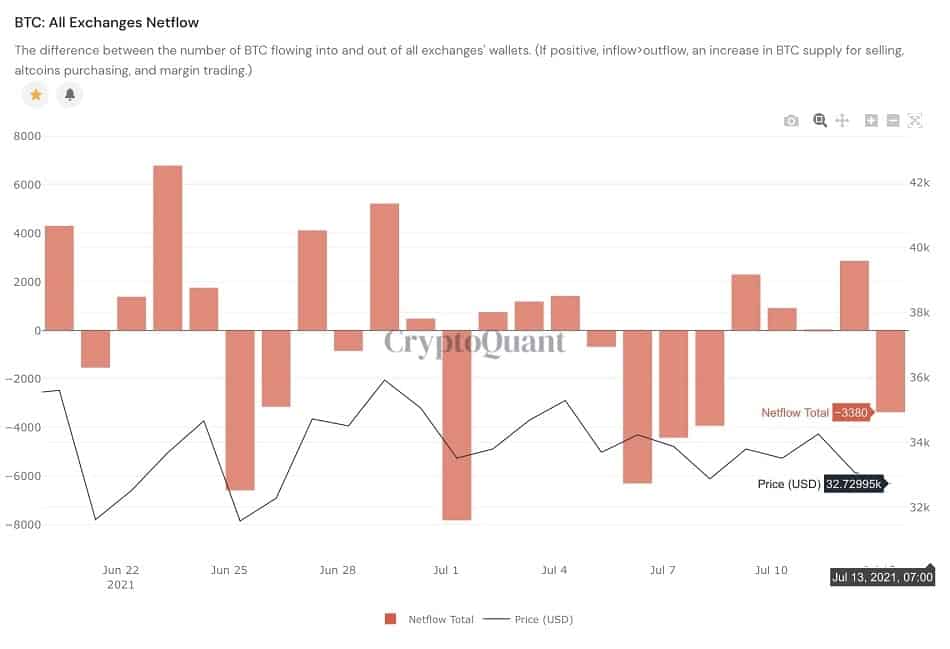
Netflows of BTC. Daily chart by CryptoQuant
However, the good news for the bulls is that there are signs of large investors stepping in and buying BTC as Net Exchange flows registered notable outflows of thousands of BTC by the hour, as can be seen on the lower-timeframe chart below:
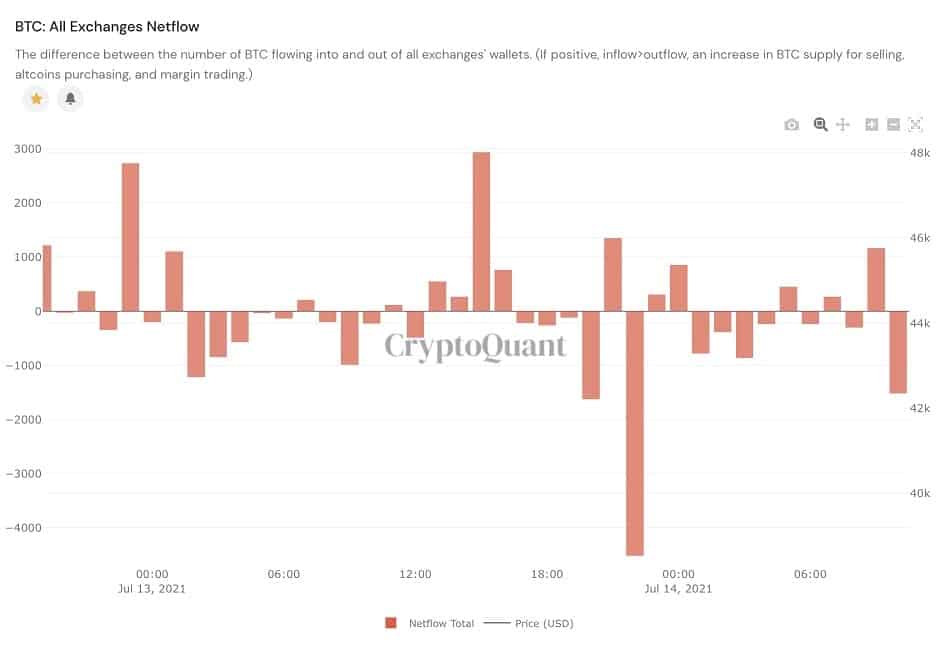
Netflows of BTC. Hourly chart by CryptoQuant
BTC Critical Support Areas To Watch
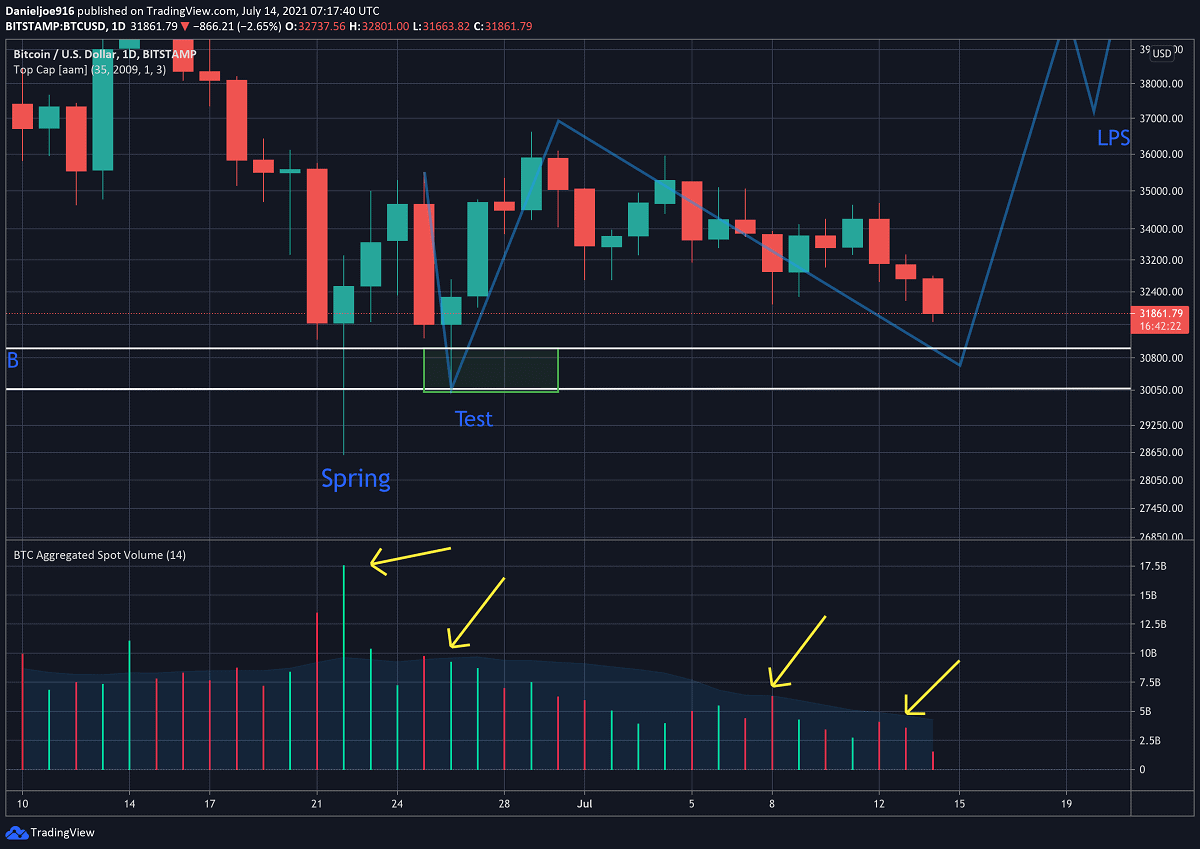
Near-term support for BTC is at $32.1k, which is the low made on July 8th, 2021. Today’s candle (Wednesday) also wicked below it, but we will have to wait for the daily close.
A daily close below this level could trigger near-term risk to the downside towards the 50-week MA (currently being tested amid $31.8K), and the lows of the test in Wyckoff Accumulation at 30.1k. As per the model, BTC must make a higher low at any price above 30.1k to maintain the bullish structure. Otherwise, it could further extend the consolidation phase or break towards $25k, or even $20k (the previous all-time high from December 2017) in another wipeout.
BTC/USD, July 14
The technicals are pointing to a very large move coming for BTC: The Bollinger Bands, a technical indicator that measures price moves in standard deviations relative to an SMA has been “squeezing”. The squeezing of the upper and lower band usually occurs before a massive move in price.
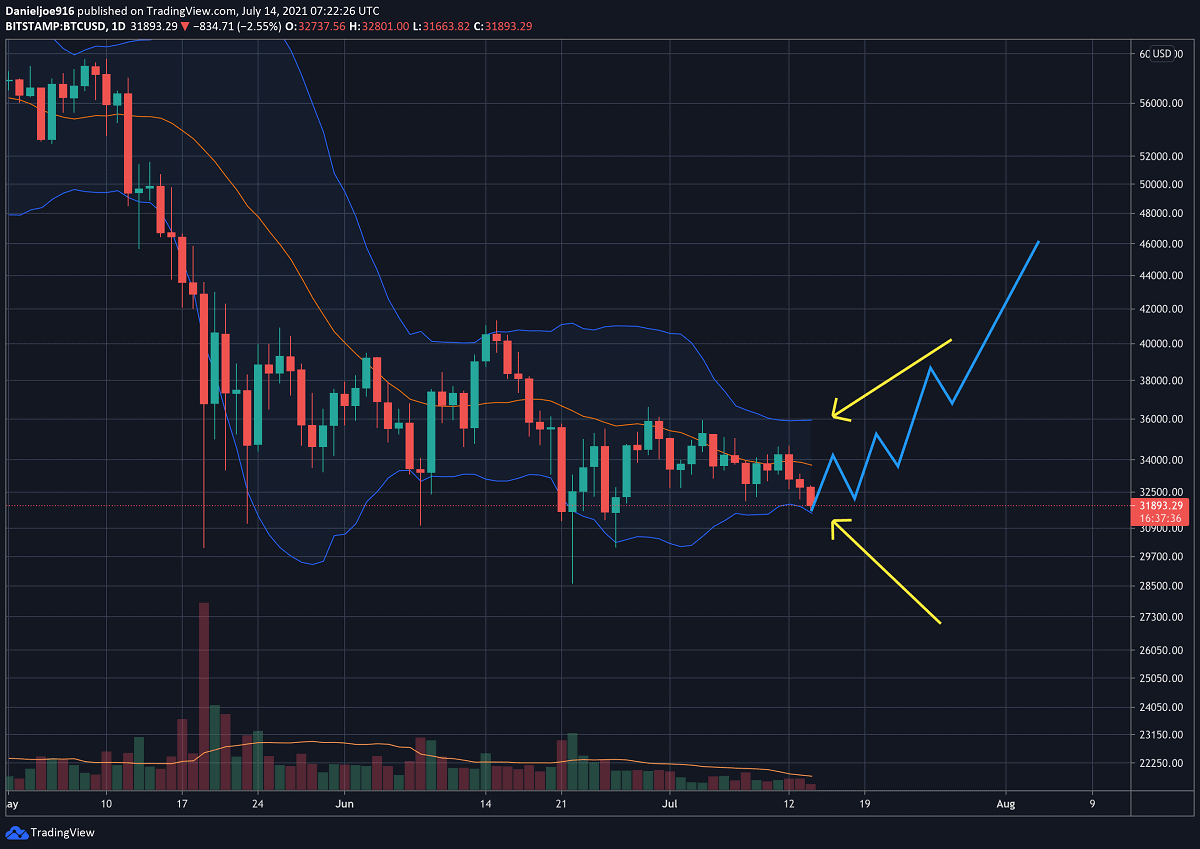
Bollinger Bands
The last time this happened was in October 2020, when BTC was trading around $10k to $11k. The Bollinger Bands Squeezed and ignited a massive breakout sending BTC from $10k to $40k in 3 months.
So far, according to the model, every drawn down since the spring and test in Phase C has registered lower aggregate volume – a sign of supply exhaustion.
Starting from the spring lows, aggregate volume came in at $17.58B, $9.25B, $6.32B, and intraday so far at $1.5B. On-chain analysts believe a supply shock is coming for BTC as soon as the remaining sellers capitulate, leading to a significant rally to the upside once new whales enter the market.
Third Largest BTC Whale adds to BTC Holdings During Dip
Despite the bearish sentiment in the market, whales continue to accumulate quietly. Just overnight, a BTC whale with the third-largest wallet added 122 BTC ($3.9 million), increasing total holdings of BTC to 116,122 BTC worth $3.7 billion.
Interestingly, this whale group had been adding bitcoins over the past two months, around the $30-31K support mark. This could be one of the reasons that the latter level has held without breaking down since May-19 (as of writing these lines).
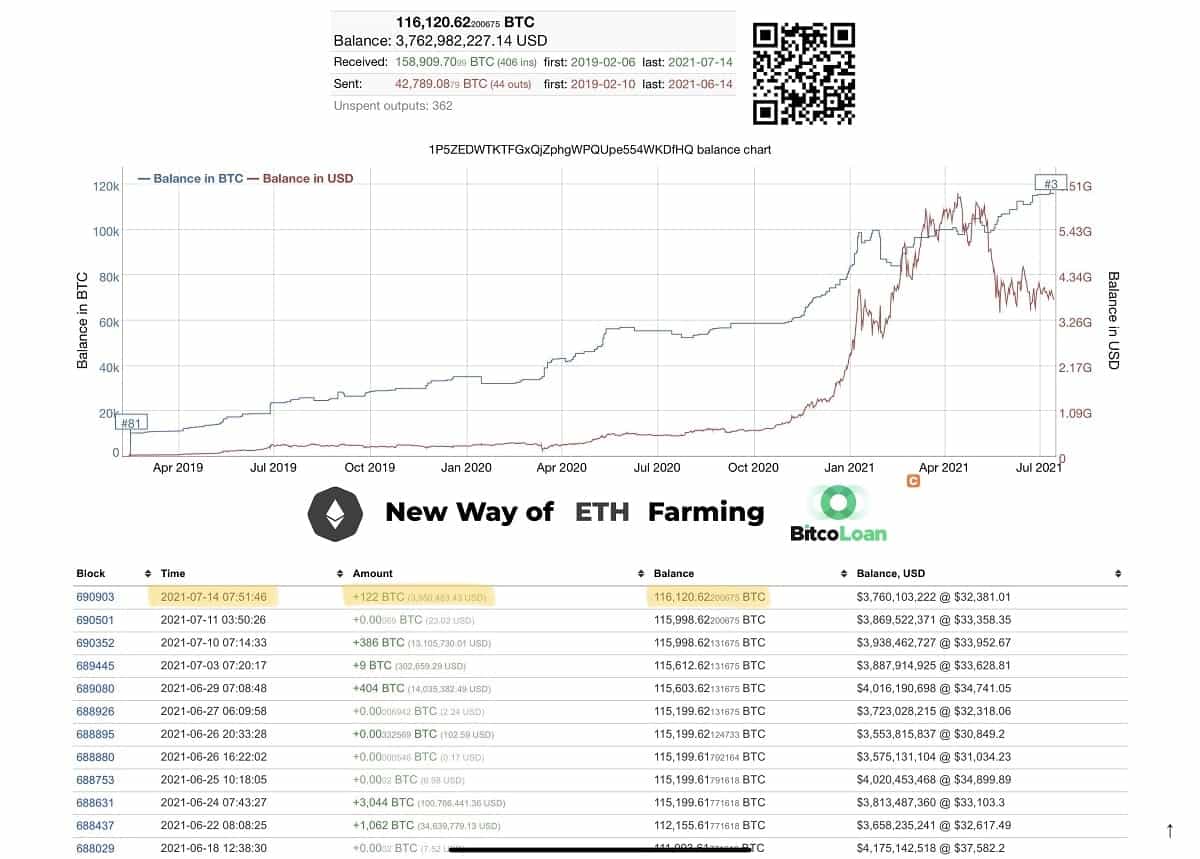
BTC third-largest whale is accumulating. Data by Bitinfocharts
In conclusion, BTC’s price is now testing major support at the 50-week MA, and the lower part of the 2-month long trading range between $30K and $42K.
Whether BTC can hold support and start breaking out to the upside out of the trading range, remains to be seen. Bullish on-chain metrics suggest a breakout is coming as soon as the supply is fully exhausted.