Ethereum started a fresh increase from the $2,550 support zone against the US Dollar. ETH price is rising, and it is likely to accelerate higher if it breaks $2,880.
Ethereum is showing positive signs above the $2,750 resistance zone. The price is well above the $2,700 support and the 100 hourly simple moving average. There was a break above a major bearish trend line with resistance near $2,750 on the hourly chart of ETH/USD (data feed via Kraken). The pair could start a strong increase if there is no break below the 100 hourly SMA and $2,700.
Ethereum Price Is Eyeing More Upsides
After retesting the key $2,550 support zone, ethereum started a fresh increase above the $2,650 resistance zone. ETH gained pace above the $2,700 and $2,720 levels.
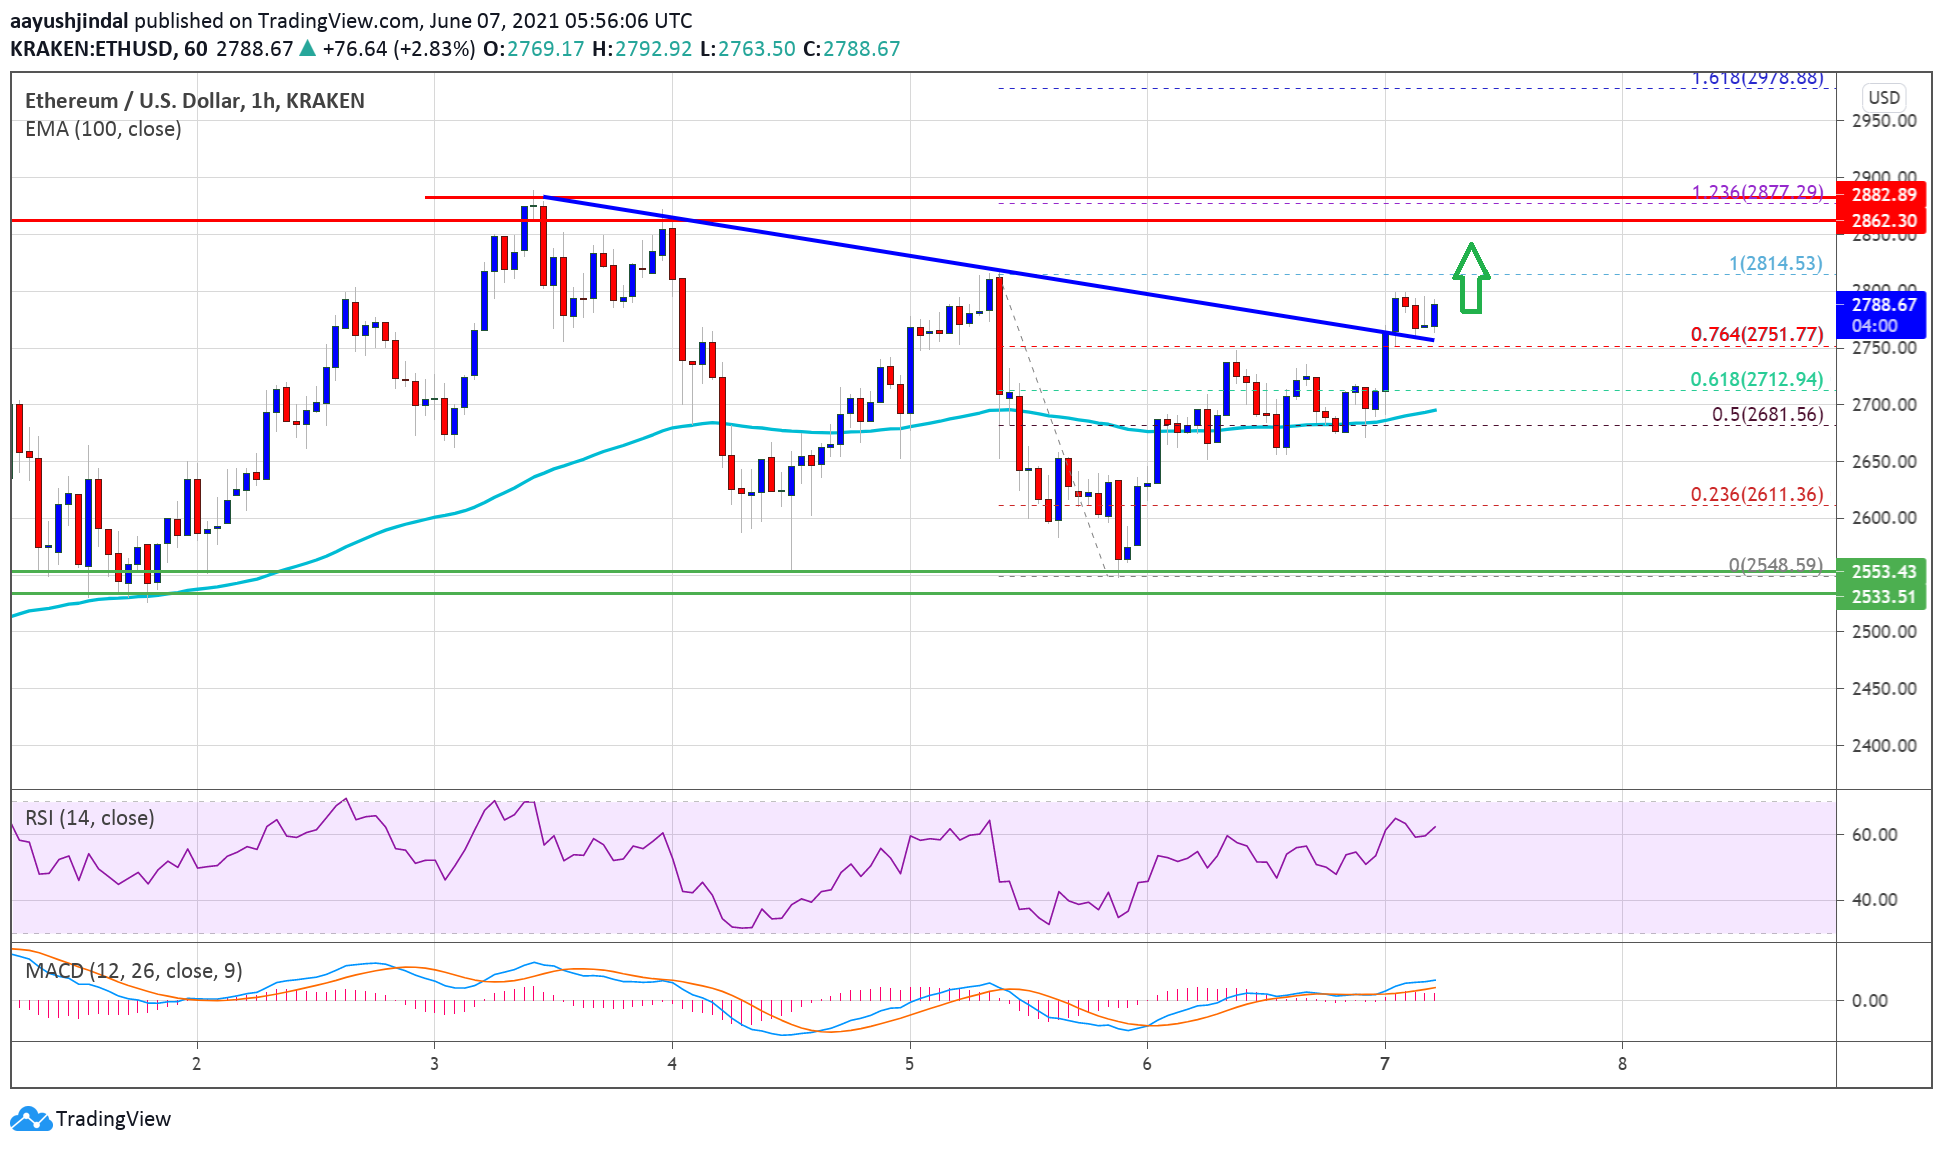
The price gained pace above the 50% Fib retracement level of the of the downward move from the $2,814 swing high to $2,548 low. There was also a break above a major bearish trend line with resistance near $2,750 on the hourly chart of ETH/USD.
The pair is now well above the $2,700 support and the 100 hourly simple moving average, unlike bitcoin. Ether is also above the 76.4% Fib retracement level of the downward move from the $2,814 swing high to $2,548 low. An immediate resistance is near the $2,814 high.
The first major resistance is near the $2,850 level. The main hurdle is near the $2,880 level. A clear upside break above the $2,880 level could set the pace for a larger increase. In the stated case, the price could test the $3,000 level.
Dips Supported in ETH?
If Ethereum fails to clear the $2,800 and $2,850 resistance levels, it could start a downside correction. An initial support on the downside is near the $2,750 level.
The main support is now forming near the $2,650 level and the 100 hourly SMA. A downside break below $2,650 and the 100 hourly SMA could open the doors for a larger decline. The next major support sits near the $2,550 zone, below which the price is likely to move into a bearish zone.
Technical Indicators
Hourly MACD – The MACD for ETH/USD is slowly gaining pace in the bullish zone.
Hourly RSI – The RSI for ETH/USD is currently above the 50 level.