

Bitcoin appears to be under heavy selling pressure, suggesting that investors are preparing to cash out.
Key Takeaways
- Bitcoin recently bounced off support to hit a high of $48,500.
- Regardless of the upswing, on-chain metrics hint at a bull trap.
- A sustained close outside of the $46,000 to $51,000 range will determine where BTC is heading next.
Bitcoin’s network activity suggests that a spike in profit-taking is imminent. Still, only a decisive break of the $46,000 support level is likely to lead to a steep decline.
Bitcoin On-Chain Metrics Turn Bearish
Bitcoin could soon experience a retrace.
The leading crypto asset has rebounded by nearly 4.6% over the last few hours after hitting a low of $46,300 on Aug. 26. The sudden upswing has caught investors by surprise, generating over $64 million worth of long position liquidations across the board.
Despite the recent spike in volatility, several on-chain metrics suggest that a sell-off could be underway.
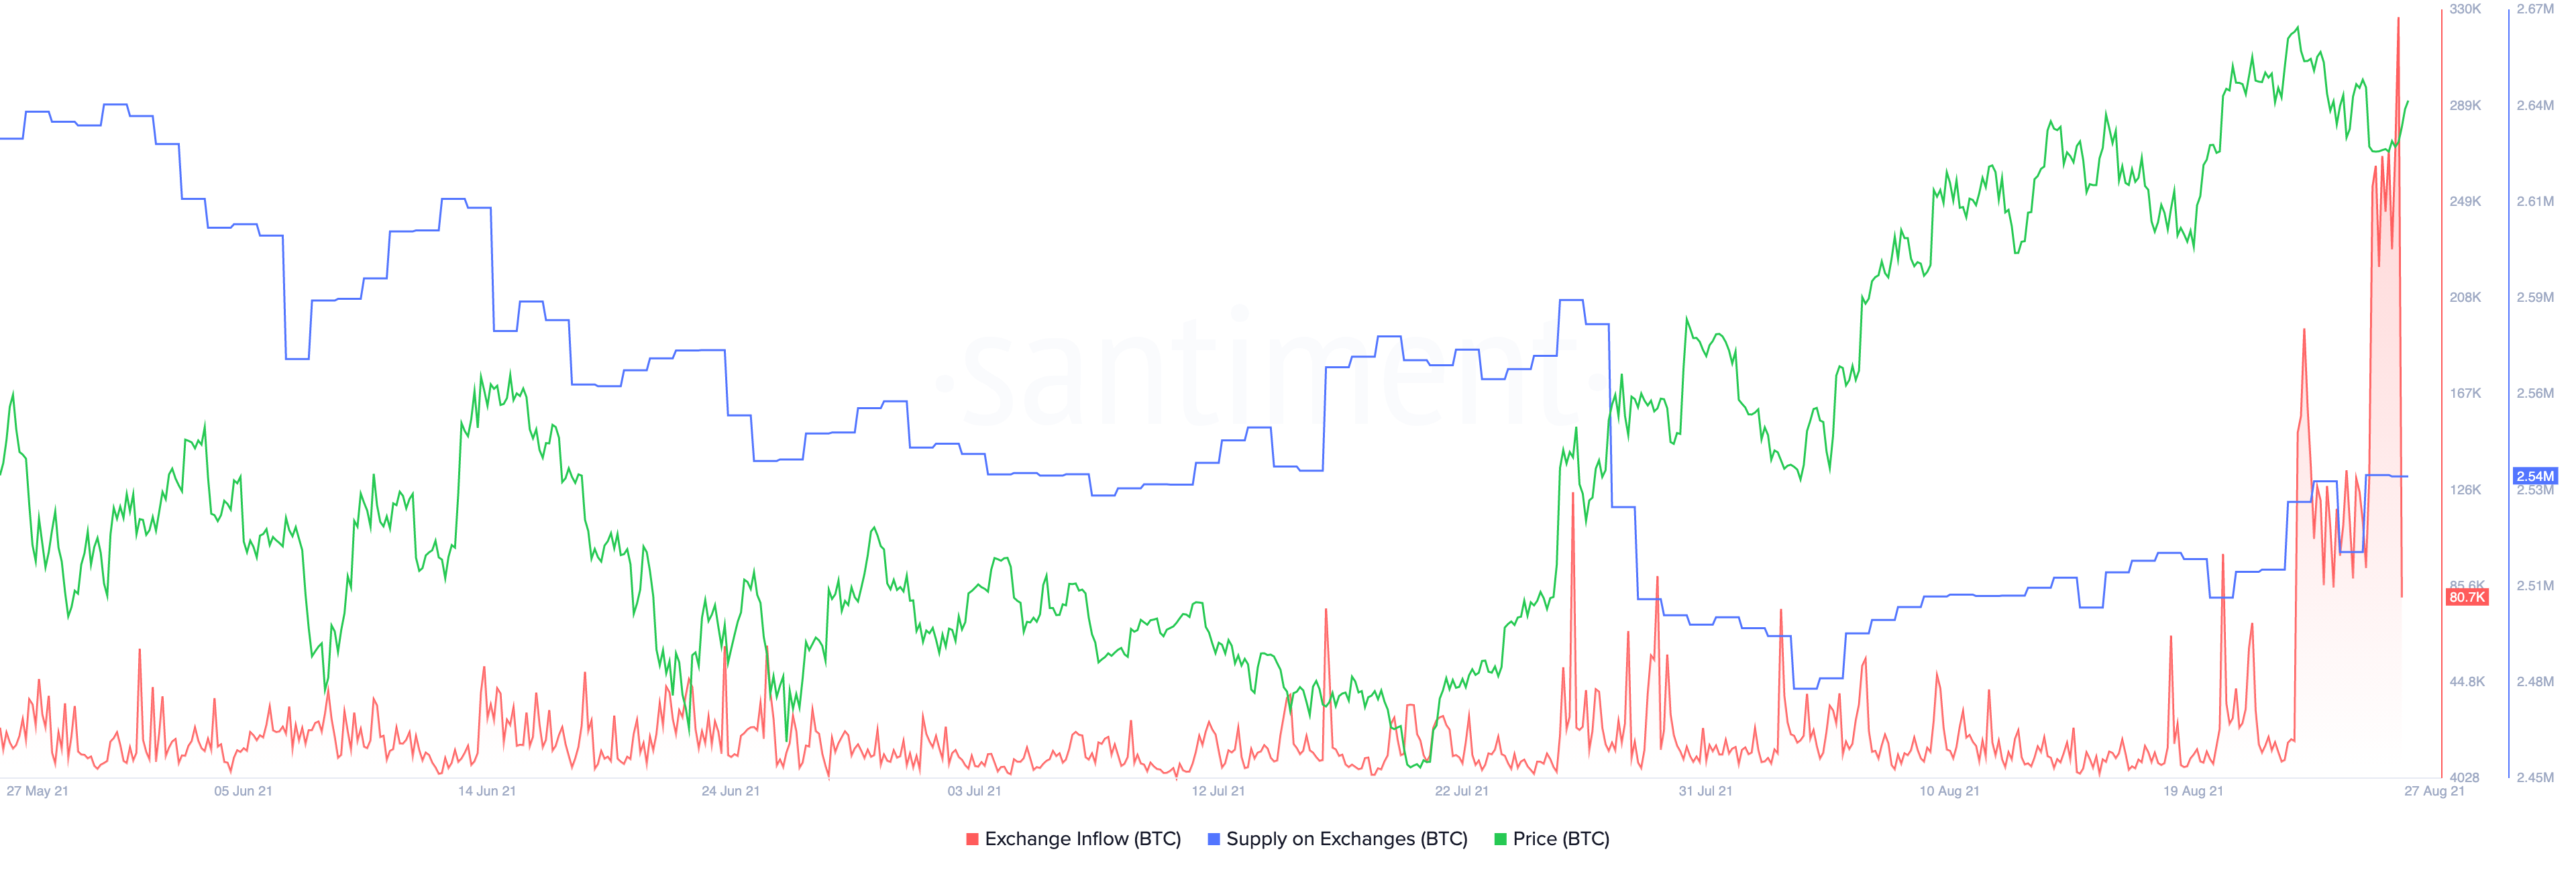
Behavior analytics platform Santiment recently recorded one of the most significant Bitcoin inflows to exchanges in over two years. Roughly 1.68 million BTC were transferred to trading platforms, which “tied for the largest inflow day of all-time.” Such market behavior coincides with a steady increase of more than 60,000 BTC held on trading platforms since Aug. 3.
#Bitcoin just made history with its largest day of exchange inflow since June 19, 2019. These days are now tied for the largest inflow day of all-time, both with 1.68M $BTC flowing to exchanges on these respective days. Expect increased volatility. https://t.co/yzOHzqlrKW pic.twitter.com/dT3JbyDD2m
— Santiment (@santimentfeed) August 27, 2021
The rising Bitcoin supply on exchanges suggests that investors could be preparing to realize profits soon, igniting a sell-off that pushes prices lower.
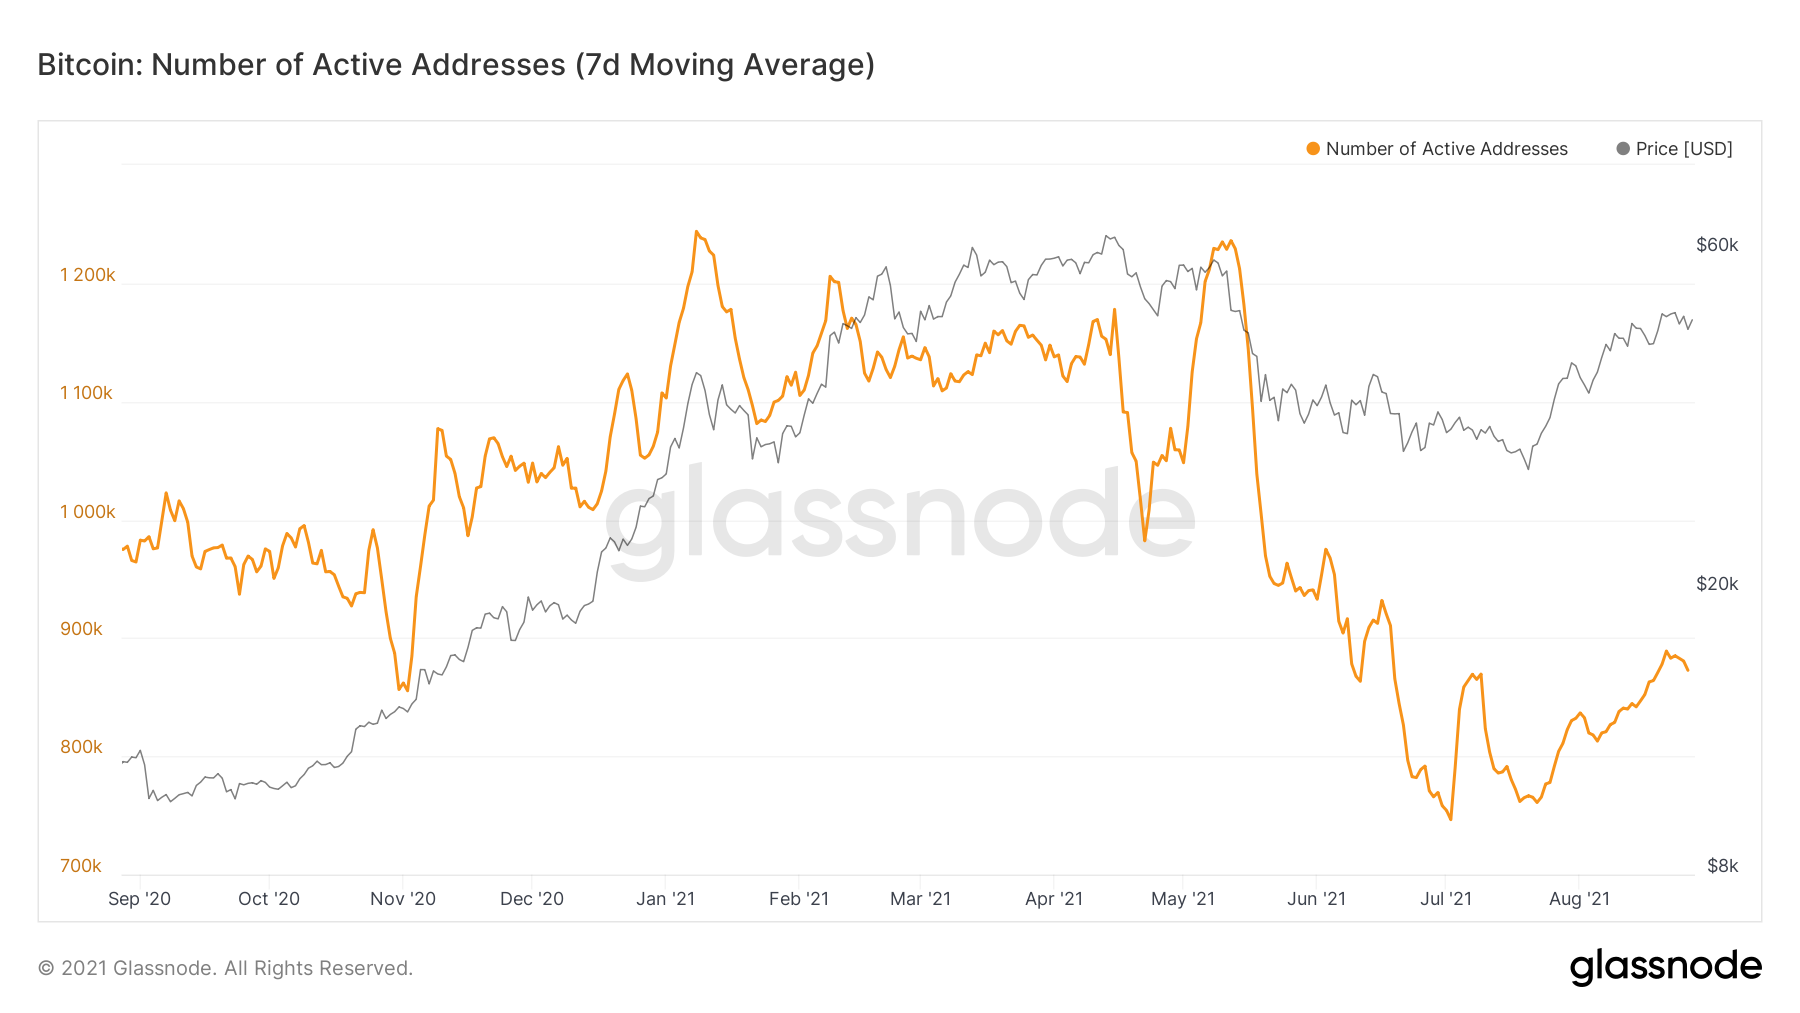
When considering the decreasing number of daily active addresses on the Bitcoin network, the inflow activity on exchanges becomes even more concerning.
Twitter user Nebraskan Gooner maintains that an influx of buyers is usually determined by a spike in the number of new addresses being created. But when this on-chain metric is declining, it suggests less interest from retail investors. He wrote:
“[In 2018,] we never saw a large influx of active wallets until we finally reached the bottom. Address activity dropped, fewer new market participants were getting involved (along with old), and volatility dropped as BTC went sideways/corrected,”
Now, the analyst believes that those who wanted to unload their Bitcoin on the market could have already done so and are now “waiting for lower prices like in 2018.”
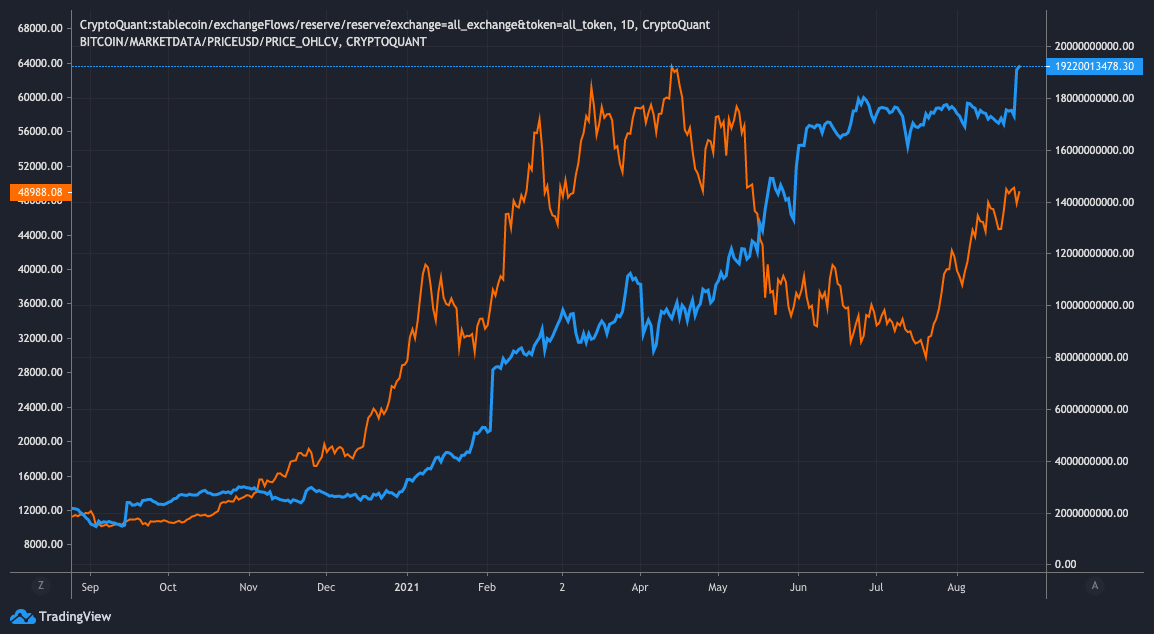
Another sign that shows that investors could be cashing out is the rising supply of stablecoins on exchanges, which recently hit a new all-time high at around $19.22 billion. Some market participants may argue that such an important spike is positive as it signals more dry powder in the system that could flow into Bitcoin.
Still, given the increase in BTC supply on exchanges, the data suggests that investors are converting their holdings into cash.
While it’s still unclear where Bitcoin is heading next, it is crucial to pay attention to the $46,000 support level and the $51,000 resistance barrier. A decisive daily candlestick close below the underlying demand wall could lead to a downswing toward $40,000, while a sustained move above the overhead supply could lead to a rise to $57,000.


